 |
A global layer of incipient melt in the asthenosphere?
Clues from electrical conductivity
|
Fabrice Gaillard
Institut des Sciences de la Terre d’Orléans, CNRS-University of Orléans, France;
fabrice.gaillard@cnrs-orleans.fr
Introduction
Partial melting has long been suspected to occur at the base of the lithosphere where low-velocity zones are indicated by seismology (>50 km beneath young oceanic crust to >80 km beneath old crust; Eggler, 1976; Gutenberg, 1959; Leeds et al., 1974). Phase diagrams, long studied by petrologic experiments (Figure 1, modified from Wallace & Green, 1988), indicate that at such depths oceanic geotherms cross the solidus of peridotite in the presence of CO2. The melts produced are CO2- and alkali-rich, and silica poor. Depending on the level of SiO2 undersaturation, these melts comprise carbonatite, kimberlite, mellilite, basanite, or alkali basalts. The amount of melt produced is believed to be incipient (<1%) as we expect the CO2 content of the mantle to be small (Dasgupta & Hirschmann, 2010: several tens of ppm weight of carbon)1. The recent discovery of small volcanoes (petit spots) erupting through old oceanic plates undergoing fissuring just before entering subduction zones supports the existence of widespread CO2-rich incipient melts below the lithosphere (Hirano et al., 2006).
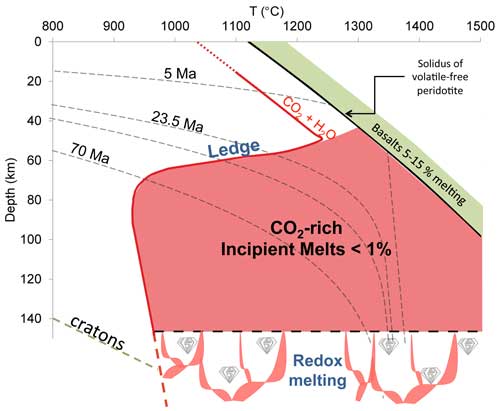
Figure 1: Melting curves for different bulk peridotitic systems as functions of temperature and depth. This Figure illustrates two contrasting mantle melting regimes: the high degree of melting regime, in green, occurring in a narrow P-T domain and producing basalts, and the incipient melting regime, in red, occurring in a vast P-T domain and producing CO2-rich melts. The red curve shows the solidus of H2O-undersaturated carbonated, fertile peridotite (pyrolite with 0.5–2.5 wt% CO2 and 0.3 wt% H2O, after Wallace & Green, 1988). For pressures <1.7 GPa, carbonated melts are unstable and gaseous CO2 prevails, which defines the "ledge", that is the upper limit of incipient melting. The lower limit of incipient melting is defined by the redox melting reaction, that is the oxidation of diamond into CO2-rich melts, occurring at depth ranging from 150 to 250 km (Rohrbach & Schmidt, 2011; Stagno et al., 2013).
The ElectroLith project
How these melts impact global mantle geodynamics is the crucial question pursued by the ElectroLith project. This question will be addressed by:
- determining the physical properties of incipient melts;
- determining how they affect the physical properties of mantle rocks; and
- identifying and mapping incipient melting in Earth’s mantle from geophysical observations.
In addition to the long-known low-seismic-velocity region of the mantle at 45-180 km below the ocean seafloor, high electrical conductivity is also detected by magnetotelluric surveys2. Such conductivity values greatly exceed those of mantle peridotite, even at high temperatures (Figure 2).
Figure 2: Electrical conductivity (σ) vs. temperature relationships for olivine, basalts, and incipient melts calculated after Sifré et al. (2014). The dashed lines shows the electrical conductivity of peridotite undergoing incipient melting (0.2 % melt connected as tubes).
The experimental setup
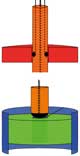
In order to evaluate the impact of incipient melting on the electrical conductivity of mantle rocks Sifré et al. (2014) developed an experimental setup specifically adapted for measurements on low viscosity liquids at mantle pressures and temperatures (Figure 3). Using this setup, conductivity measurements on the CO2-rich and H2O-rich melts that are typically produced during mantle incipient melting are possible. Measurements were done by Sifré et al. (2014) on carbonatites, kimberlites, mellilites, basanites and basaltic melts containing up to 49 wt% CO2 and 10 wt% H2O.
Figure 3: Set-up of electrical conductivity measurement using four wires. Piston–cylinder assemblies were modified to permit electrical conductivity measurements on fully molten samples containing large amounts of volatiles. The ability of the system to maintain both CO2 and water contents during exposure at temperatures up to 1500°C was demonstrated by Sifré et al. (2014).
Results
Only one type of melt (carbonated basalts with 25 wt% SiO2, 17 wt% CO2 and 4 wt% H2O) is illustrated in Figure 2. Such a melt is 10 times more conductive than incipient melts produced in the absence of CO2 (i.e. hydrous basalts) and 10,000 times more conductive than hydrated olivine. The implication is that minute amounts of such melt can greatly enhance the electrical conductivity of mantle rocks. It also appears that the CO2-rich nature of the melt is a requirement to make it conductive since H2O-rich melts are not as conductive (Figures 2 & 4). Figure 4 clearly shows that there is a threshold in the CO2 content (5-10 wt%) that is required to strongly affect the electrical conductivity of the melt. This non-linear change in electrical conductivity along the carbonate-silicate chemical divide probably reflects a profound change in the molecular structure of the melt as it evolves from covalent polymers (silicate) to purely ionic liquids (carbonate).
Figure 4: Strongly non-linear changes in melt electrical conductivity (σ) along the basalt-carbonate chemical divide. The threshold at ca. 5-10 wt% CO2 in the melt suggests a major change in the physical properties from covalent polymers to purely ionic liquids.
Interpretation
Figure 1 shows that as little as 0.2% of incipient melts connected as tubes along peridotite grain edges can explain the ranges of electrical conductivity detected by magnetotelluric surveys. Because the temperature dependence of the electrical conductivity is small (Figure 2) and because these melts are stable from ca. 900 - 1360°C (the latter temperature being the volatile-free solidus at 2-3 GPa; see Figure 1), their widespread presence beneath the oceanic lithosphere, regardless of whether it is young or old, can explain the high conductivity detected in the asthenosphere.
The process of segregation and ascent of incipient melt, due to its presumed low viscosity and density, is not considered here. At such low porosities (<1%) it is difficult evaluate whether incipient melt segregates and ascends faster than solid flow in the asthenosphere under the moving plates. If incipient melts are extracted from their zone of formation, their ascent must be ultimately obstructed by the so-called “ledge” (Wallace & Green, 1989; Figure 1). This is a reaction that involves CO2 volatilization inducing melt freezing and clinopyroxene crystallization that is expected to occur at depths of 50-90 km depending on the age of the overlying oceanic crust, which is assumed to define the temperature at the base of lithosphere. The upper and lower boundaries of incipient melting are illustrated in Figure 5. The upper limit is the “ledge” and the lower limit is defined by redox melting, i.e. the oxidation of diamonds producing CO2-rich melts (Foley, 2011; Rohrbach & Schmidt, 2011; Stagno et al., 2013). Beneath Phanerozoic continents and cratons, the top of the region of incipient melting deepens because of cooler temperatures (Figures 1 & 5).

Figure 5: The geodynamics of melting in the low-velocity zone. There is widespread incipient melt in the asthenosphere from young ocean to ancient cratons. Click here or on Figure for enlargement.
Whether or not incipient melts explain low-seismic-velocity zones remains to be answered. This strictly depends on the ability of melt to fully wet the peridotite grains at small degrees of melting. CO2-rich melts have long been known to wet olivine grains efficiently (Hunter & McKenzie, 1989) and recent thorough investigations indicate that melt films at grain boundaries can be present even at small melt fractions (Garapic et al., 2013). Conventional wisdom has assumed in the past that melt must be connected by tubes. In addition, segregation-ascent processes may complicate the picture further by triggering layering where melt can accumulate (Sakamaki et al., 2013).
Figure 5 suggests that incipient melting, producing CO2-rich, alkali-rich, low-silica melts, is widespread beneath the oceanic lithosphere and can explain the high electrical conductivity of the asthenosphere. Whether incipient melt can reduce S-wave velocities by 5 - 10%, as is generally observed beneath the oceanic lithosphere, is currently unknown. Incipient melting must also occur beneath Phanerozoic continents at depths of ca. 90 km. It is tenuous beneath ancient cratons since the depth at which incipient melting is expected (ca. 140 km) overlaps with the depth of redox melting (Figures 1 & 5), implying absence of the window of incipient melting.
The CO2- and alkali-rich melt produced by petit spot volcanoes on the seafloor is similar to many regions of alkaline magmatism found on continents (e.g., Chaines des Puys, Central Massif, France) that propagated through fissures in the lithosphere. All these extrusive rocks are probably the erupted portion of the incipient melt that results from the small amounts of CO2 that is widespread in the seismic low-velocity zone below the oceans and continents.
1
2
References
-
Dasgupta, R. & Hirschmann, M. M. The deep carbon cycle and melting in Earth’s interior. Earth Planet. Sci. Lett. 298, 1–13 (2010).
-
Eggler, D.H. Does CO2 cause partial melting in the low-velocity layer of the mantle?, Geology, 4, 69-72 (1976).
-
Garapic, G., Faul, U. H. & Brisson, E. High-resolution imaging of the melt distribution in partially molten upper mantle rocks: evidence for wetted two-grain boundaries. Geochem. Geophys. Geosyst. 14, 556–566 (2013).
-
Gutenberg, B. Physics of the Earth's Interior. New York: Academic Press. p. 240, (1959).
-
Hirano, N. et al. Volcanism in response to plate flexure. Science 313, 1426–1428 (2006).
-
Hunter, R. H. & McKenzie, D. The equilibrium geometry of carbonate melts in rocks of mantle composition. Earth planet. Sci. Lett. 92, 347−356 (1989).
-
Leeds, A. R., Knopoff, L., and Kausel, E. G., Variations of upper mantle structure under the Pacific Ocean: Science, 186, p. 141-143, (1974).
-
Minarik, W. G. & Watson, E. B. Interconnectivity of carbonate melt at low melt fraction. Earth Planet. Sci. Lett. 133, 423–437 (1995).
-
Presnall, D.C. and Gudfinnsson, G.H. Carbonate-rich melts in the oceanic low-velocity zone and deep mantle. In: Foulger, G.R., Natland, J.H., Presnall, D.C. & Anderson, D.L. (eds.) Plates, Plumes, and Paradigms. Geological Society of America Special Paper 388, 207-216 (2005).
-
Rohrbach A & Schmidt M.W. Redox freezing and melting in the Earth’s deep mantle resulting from carbon–iron redox coupling Nature 472, 209–212 (2011).
-
Sakamaki, T. et al. Ponded melt at the boundary between the lithosphere and asthenosphere. Nat. Geosci. 6, 1041–1044 (2013).
-
Schmerr, N. The Gutenberg discontinuity: melt at the lithosphere-asthenosphere boundary. Science 335, 1480–1483 (2012).
-
Sifré, David, Emmanuel Gardés, Malcolm Massuyeau, Leila Hashim, Saswata Hier-Majumder & Fabrice Gaillard, Electrical conductivity during incipient melting in the oceanic low-velocity zone, Nature, 509, 81–85, doi:10.1038/nature13245
-
Wallace, M. E.&Green, D. H. An experimental determination of primary carbonatite magma composition. Nature 335, 343–346 (1988).
last updated 11th
September, 2014 |