 |
Continental Delamination: Insights from Laboratory Models
|
Flora Bajolet1*, Javier Galeano2, Francesca Funiciello1, Monica Moroni3, Ana-María Negredo4, Claudio Faccenna1
1Dipartimento Scienze Geologiche, Università "Roma TRE", Largo S. L. Murialdo 1, 00146 Rome, Italy. flora.bajolet@uniroma3.it ; ffunicie@uniroma3.it ; faccenna@uniroma3.it
2Dpto. Ciencia y Tecnología Aplicadas, EUIT Agrícola, U. Politécnica de Madrid, 28040 Madrid, Spain. javier.galeano@upm.es
3DICEA, Sapienza Università di Roma, via Eudossiana 18, 00184 Rome, Italy. monica.moroni@uniroma1.it
4Dpto. Física de la Tierra, Astronomía y Astrofísica I, and Instituto de Geociencias (CSIC-UCM). Facultad de Ciencias Físicas, Univ. Complutense Madrid, 28040 Madrid, Spain. anegredo@fis.ucm.es
This webpage is a summary of: Bajolet, F.; Galeano, J.; Funiciello, F.; Moroni, M.; Negredo, A.-M.; Faccenna, C., Continental delamination: Insights from laboratory models, Geochem. Geophys. Geosyst., 13, Q02009, 2012.
Delamination
One of the major issues of the evolution of continental lithospheres is the detachment of the lithospheric mantle that may occur under certain conditions, and its impact on the surface.
Delamination has often been proposed to explain observations such as regional uplift associated with alkaline volcanism, anomalously high heat flow, and change of stress field toward extension in various geodynamic contexts [e.g., Bird, 1978; Arnold et al., 2001; Le Pourhiet et al., 2006; Valera et al., 2008; Gogus & Pysklywec, 2008a; Fillerup et al., 2010; Levander et al., 2011].
The main focus of this webpage is study of the dynamics of continental delamination using laboratory models to explore the influence of various parameters such as initial structure and rheological properties, and the relationships between deep dynamics (mantle circulation), surface deformation (deformation, isostatic reequilibration, dynamic topography), and plate motion.
Experimental setup
We performed a parametric study using physically-scaled laboratory models. These comprise a three-layer, visco-elastic body (an analog for the upper crust, lower crust, and lithospheric mantle) locally thickened/thinned to simulate a density anomaly (lithospheric root) and an adjacent weak zone, overlying a low-viscosity material that simulates the asthenosphere (Figure 1). Each model is monitored using a sequence of digital pictures taken in lateral and top views. We also record the evolution of the surface topography with a 3D-laser scanner (Real Scan USB) with a precision of 0.1 mm, corresponding to 830 m in nature. The evolution of delamination is monitored using the Feature Tracking (FT) image analysis technique on representative experiments.
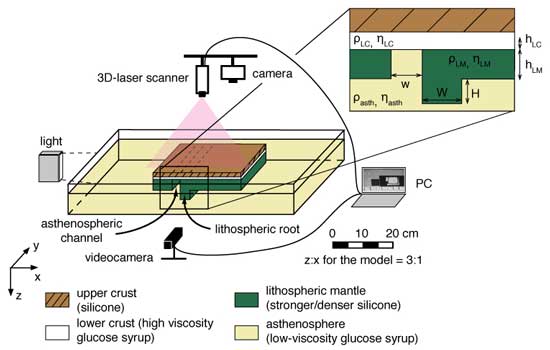
Figure 1: The experimental setup.
Evolution of the reference experiment
The evolution of the reference experiment DEL10 is representative of the typical scenario occurring during delamination. The results emphasize the interplay between mantle flow, deformation, surface topography and plate motion during a three-phases process:
-
A slow initiation phase, during which the edge of the unstable thickened lithospheric mantle slowly starts to peel away from the overlying lower crust along the length of the asthenospheric channel, and displaces underlying mantle material proward (Figure 2a). This phase is associated with contraction (Figure 3a) and dynamic subsidence above the lithospheric root (Figure 4a,d).
- Lateral propagation of the delamination along with extension (Figure 3b), while poloidal mantle flow develops around the tip of the delaminating lithospheric mantle (DLM: Figure 2b,c). A complex topographic signal results, comprising a dynamic bulge and a dynamic depression. The topography is complex, comprising a dynamic bulge, a dynamic depression and a flexural bulge. This whole pattern migrates with the hinge of delamination (Figure 4b,d).
- A late phase, characterized by a counterflow that triggers retroward motion of the whole model (Figure 2d). The topographic signal increases in amplitude (Figure 4c,d) and extension expands above the delaminated area (Figure 3c).
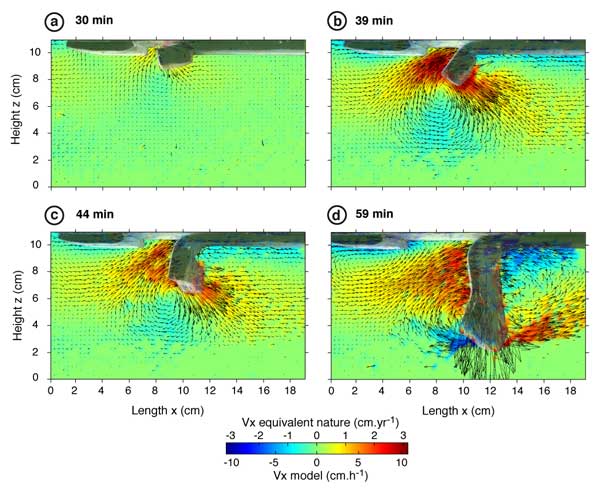
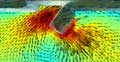
Figure 2: Velocity field (lateral view) for experiment DEL10 at four different stages of the delamination: a) 30 min – after initiation, b) 39 min – at the end of the main phase of delamination, c) 44 min – at the change in dynamic with strong increase in retroward motion of the model, d) 59 min – during the last phase of delamination, just before the DLM reaches the bottom of the box. Color scale represents the velocity in the x direction (length, positive in the proward direction). Shadowed images underline the position of the model.
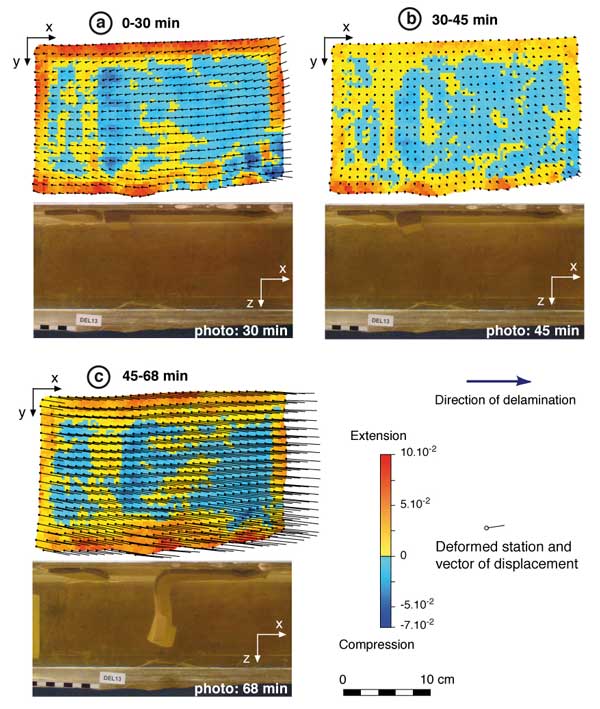
Figure 3: 2D finite strain map of the upper crust (top view) and corresponding side view photos at 3 different stages of the delamination for experiment DEL13: a) initiation between 0 and 30 min, b) main phase between 30 and 45 min, c) final phase between 45 and 68 min. Finite strain is computed with SSPX software [Cardozo & Allmendinger, 2009]. Initial and final coordinates of reference points drawn on the upper silicone are transformed into a displacement gradient tensor from which is calculated the strain gradient tensor. The deformation field is then computed with a grid-nearest neighbor method.

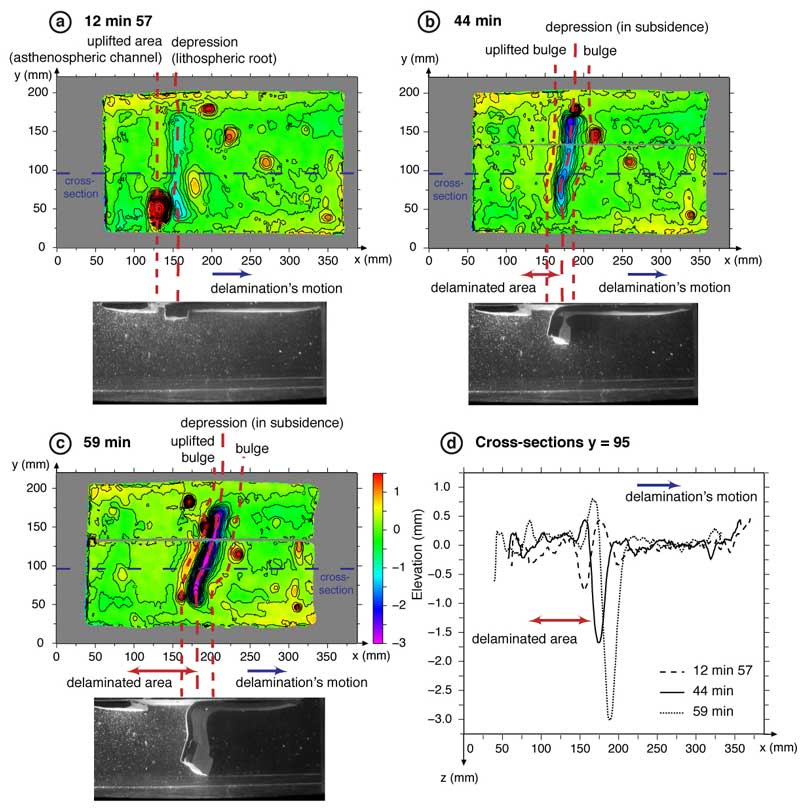
Figure 4: Side view photos and surface topography for the reference experiment (DEL10) at three stages of the delamination process: a) 12 min 57 s during initiation phase, b) 44 min at the transition between main and final phase, c) 59 min during final phase, with corresponding cross-sections (d) taken along the reference dotted blue line. The high (red) circular zones are air bubbles trapped between the layers during the construction of the model. Later experiments free of that experimental bias showed that it does not affect significantly the delamination process. Click here or on image for enlargement.
Sensitivity analysis
We performed a parametric study to test how the initial geometrical configuration and rheological properties of the lithosphere can influence the evolution of delamination. The main features characterizing the delamination process are invariant for all the experiments, but the timescale, mantle flow velocity, and amplitude of the surface features depend on the adopted parameters.
A dominant role is played by the gravitational instability of the lithospheric root. The amplitude of the topography, as well as the velocity of delamination, are primarily controlled by the density and viscosity contrast between lithosphere and asthenosphere. Relief will be higher and delamination faster for a thick, dense, strong lithospheric root.
Forces at work during delamination, and empirical constraints
The main driving force is the gravitational instability generated by the lithospheric root that progressively pulls down the lithospheric mantle. The root pull increases with time as more lithospheric mantle is delaminated. The resisting forces include the shear resistance at the lower crust/lithospheric mantle boundary (i.e. coupling), the bending resistance, and the asthenosphere resistance at the interface with the DLM.
From this force analysis, a semi-quantitative study allows us to determine empirically two parameters, representative of the ratio of driving forces over resisting forces:
- an initiation parameter I that constrains the propensity of the delamination to occur and correlates with the duration of the first stage of delamination, and
- a buoyancy parameter B characterizing the delamination velocity during late stages and therefore its propensity to cease.
The conditions required for delamination can be studied by plotting B versus I (Figure 5). If I is too small, delamination will not start. Moreover, in a natural system, we expect the process to freeze if the motion is too slow (i.e. if B is too small) event though initiation was possible.
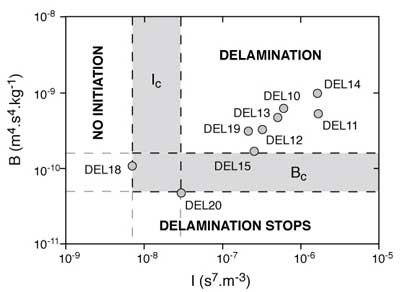
Figure 5: Plot of the initiation parameter (I) versus the buoyancy parameter (B). Domains where delamination does not occur, stops during the process, or continues are constrained by experiments DEL18, DEL20, and DEL15. Shaded areas represent the uncertainties on the critical values Ic and Bc delimiting the different domains.
Comparison with natural systems: Sierra Nevada (California, USA)
The experimental models are oversimplified, but we can try to apply them to understand the behavior of natural systems, taking into account the limitations. We focus on a qualitative comparison with the southern Sierra Nevada range (California, USA), as many observations compatible with delamination are found in this area [Ducea & Saleeby, 1998; Jones et al., 2004; Zandt et al., 2004; Le Pourhiet et al., 2006].
The global topographic pattern obtained in the analog models reproduces well the surface features of the Sierra Nevada region. The depression over the sinking DLM is consistent with the subsidence currently recognized in the Tulare Lake basin (southern Great Valley; Saleeby & Foster, 2004). The order of magnitude of both isostatic reequilibration (2 km) and a dynamically uplifted bulge (1.7 - 6.7 km) obtained in the laboratory (Figure 4) are similar to the estimated uplift of the Sierra >1 km [e.g., Jones et al., 2004 and references therein].
Partial melting found in the lower crust under the Sierra Nevada [Ducea & Saleeby, 1998], return-flow [Boyd et al., 2004] and a high alkaline magmatic pulse migrating over the last 4-3 Ma [Manley et al., 2000] are observations also compatible with our experimental study where asthenosphere intrudes the base of the crust (Figure 2).
For simplicity, the experiments performed in this study are always characterized by free boundaries while in nature plates are laterally confined. In particular, it would imply that the plate motion recorded during the last stage of our experimental delamination is not realistic since a laterally constrained natural plate would exhibit a strong active shortening retroward of the direction of the delamination, as recorded in models characterized by free-slip boundary conditions [e.g., Schott & Schmeling 1998]. Thus, in nature, the topographic signal could also be affected by additional uplift due to thickening of the crust.
Conclusions
The present work highlights the dynamics of continental delamination with little internal deformation, that is triggered by the presence of a density anomaly (lithospheric root) and a weak zone. Our results show that delamination is first controlled by coupling between lower crust and lithospheric mantle and bending resistance of the DLM during a slow initiation phase. Delamination then evolves toward a root-pull-dominated phase during which the DLM adopts the dynamics of a Stokes’ sinker. Many features of our models are consistent with observations in the Sierra Nevada, such as overall topographic signal, migration of extension and volcanism.
References
-
Arnold, J., W. R. Jacoby, H. Schmeling, and B. Schott (2001), Continental collision and the dynamic and thermal evolution of the Variscan orogenic crustal root - numerical models, J. Geodyn., 31, 273-291, doi:10.1016/S0264-3707(00)00023-5.
-
Bird, P. (1978), Initiation of Intracontinental Subduction in the Himalaya, J. Geophys. Res., 83, 4975-4987, doi:10.1029/JB083iB10p04975.
-
Cardozo, N., and R. W. Allmendinger (2009), SSPX: A program to compute strain from displacement/velocity data, Comput. Geosci., 35, 1343-1357, doi:10.1016/j.cageo.2008.05.008.
- Ducea, M., and J. Saleeby (1998), A case for delamination of the deep batholithic crust beneath the Sierra Nevada, California, Int. Geol. Rev., 40, 78-93, doi:10.1080/00206819809465199.
-
Fillerup, M. A., J. H. Knapp, C. C. Knapp, and V. Raileanu (2010), Mantle earthquakes in the absence of subduction? Continental delamination in the Romanian Carpathians, Lithosphere, 2, 333-340, doi:10.1130/L102.1.
-
Gogus, O. H., and R. N. Pysklywec (2008a), Mantle lithosphere delamination driving plateau uplift and synconvergent extension in eastern Anatolia, Geology, 36, 723-726, doi:10.1130/G24982A.1.
-
Le Pourhiet, L., M. Gurnis, and J. Saleeby (2006), Mantle instability beneath the Sierra Nevada mountains in California and Death Valley extension, Earth Planet. Sci. Lett., 251, 104-119, doi:10.1016/j.epsl.2006.08.028.
-
Levander, A., B. Schmandt, M. S. Miller, K. Liu, K. E. Karlstrom, R. S. Crow, C. T. A. Lee, and E. D. Humphreys (2011), Continuing Colorado plateau uplift by delamination-style convective lithospheric downwelling, Nature, 472, 461-465, doi:10.1038/nature10001.
-
Manley, C. R., A. F. Glazner, and G. L. Farmer (2000), Timing of volcanism in the Sierra Nevada of California: Evidence for Pliocene delamination of the batholithic root?, Geology, 28, 811-814, doi:10.1130/0091-7613(2000)28<811:tovits>2.0.co;2.
-
Saleeby, J., and Z. Foster (2004), Topographic response to mantle lithosphere removal in the southern Sierra Nevada region, California, Geology, 32, 245-248, doi:10.1130/g19958.1
-
Schott, B., and H. Schmeling (1998), Delamination and detachment of a lithospheric root, Tectonophysics, 296, 225-247, doi:10.1016/S0040-1951(98)00154-1
-
Seber, D., M. Barazangi, A. Ibenbrahim, and A. Demnati (1996), Geophysical evidence for lithospheric delamination beneath the Alboran Sea and Rif-Betic mountains, Nature, 379, 785-790, doi:10.1038/379785a0.
-
Valera, J. L., A. M. Negredo, and A. Villasenor (2008), Asymmetric Delamination and Convective Removal Numerical Modeling: Comparison with Evolutionary Models for the Alboran Sea Region, Pure Appl. Geophys., 165, 1683-1706, doi:10.1007/s00024-008-0395-8.
-
Zandt, G., H. Gilbert, T. J. Owens, M. Ducea, J. Saleeby, and C. H. Jones (2004), Active foundering of a continental arc root beneath the southern Sierra Nevada in California, Nature, 431, 41-46, doi:10.1038/nature02847.
last updated 27th March, 2012 |