 |
Deep
and near-surface consequences of root removal
by asymmetric continental delamination |
J.L. Valera1,
A.M. Negredo1,2 and
I. Jiménez-Munt3
1Departamento de Física de la Tierra,
Astronomía y Astrofísica-I,
Facultad de CC. Físicas, Plaza de Ciencias 1. 28040-Madrid, Spain, jlvalera@fis.ucm.es anegredo@fis.ucm.es
2Instituto
de Geociencias (CSIC-UCM), Facultad de CC. Físicas,
Plaza de Ciencias 1. 28040-Madrid, Spain, anegredo@fis.ucm.es
3Instituto
de Ciencias de la Tierra ‘Jaume
Almera’. CSIC. C/ Sole i Sabaris s/n. 08028 Barcelona.
Spain, ivone@ictja.csic.es
This webpage is a summary of the paper: Valera,
J.L., A.M. Negredo, I. Jiménez-Munt, Deep
and near-surface consequences of root removal by
asymmetric continental delamination, Tectonophysics, 502,
257-265, 2011.
Continental delamination is a mechanism commonly invoked
in many areas to explain removal of continental lithospheric
mantle. Delamination is different from convective removal
processes, and very few physical-numerical models have
been developed (e.g. Scott & Schmeling,
1998; Morency & Doin, 2004; Gögüs & Pysklywec,
2008). As a result, basic aspects of this process remain
poorly understood. Moreover, the consequences of the
delamination mechanism on the evolution of surface
and near-surface observables, namely the crustal structure,
topographic response (both isostatic and dynamic) and
surface heat flow, are still under debate. We present
results of numerical simulations considering different
initial setups, representative for different geodynamic
scenarios prone to delamination, focusing on the evolution
of the previously mentioned observables. We used the
thermo-mechanical numerical algorithm TEMESCH developed
by Valera et al. (2008) in MATLAB code (Negredo
et al.,
2004; Valera et al. 2008).
Figure 1 presents the evolution of
our Reference Model. It has an orogenic lower crust
with a density of 3050 kg/m3, and mimicks
a post-collisional orogenic scenario. The leftwards
migration of the delaminated slab pulls the thickened
crust and produces crust/lithosphere thickening in
front of the migrating delamination point and crust/lithosphere
thinning behind it. The space vacated by the migrating
lithospheric mantle is filled up by the ascent of asthenospheric
mantle up to the Moho. This coupled crustal
thickening/thinning is
also obtained in the modeling of Schott & Schmeling (1998)
and by Gögüs & Pysklywec (2008)
and can therefore be considered to be a characteristic
feature of the delamination mechanism. Lower
crustal material is pulled down by viscous drag of
the delaminated lithospheric mantle, and the Moho reaches
depths of about 100-130 km at around 15 Ma. The
dragged-down crust forms a thin, vertically elongated
layer over the sinking lithospheric material, similar
to the typical shape adopted by crust in an oceanic
subduction zone.
Figure 1: Evolution of the Reference Model for
the delamination process. Colors represent temperature
distribution with labels in ºC; white lines show
the bases of the upper and lower crust. Click here or
on figure for enlargement.
Figure 2 shows a comparison after 15 Ma of the evolution
of the Reference Model (Figure 2a-c) and another model
with a less-dense lower crust (Figure 2d-f). It is
remarkable that by reducing only the density of the
orogenic lower crust the delamination process is significantly
slowed down. We can therefore infer that, at least
for this orogenic crust initial configuration, the density
of the orogenic lower crust strongly affects the development
of delamination, although the patterns of
predicted surface heat flow and topography are similar
for both models. The predicted local isostatic topography
shows a leftwards migrating pattern of uplift/subsidence,
following the leftwards migration of delaminating lithospheric
mantle and of crustal thickening over the slab.
Figure 2: Comparison after 15 Ma
of evolution of the Reference Model (a-c) and a model
with a less dense lower crust of 2950 kg/m3 (d-f).
The compared observables are the surface heat flow
(a, d), the local isostatic topography (b, e) and
the density distribution (c, f) showing only a series
of discrete values for density. Click here or
on figure for enlargement.
Figure 3 shows predicted dynamic topography
after 15 Ma of evolution of two models with exactly
the same configuration and density as shown in Figure
2, but introducing a ‘soft sediments’ upper layer
in order to allow for the top of the crust to behave
as a free surface. In these models, delamination develops
slightly slower than in models without this layer because
isotherms are shifted upwards to include this new layer.
Therefore the lithosphere is initially hotter and slightly
more buoyant than in models without a ‘soft sediment’ layer.
The predicted dynamic topography shows surface subsidence
adjacent to the delaminating lithospheric mantle for
the model with a high-density orogenic lower crust
(Figure 3a), and surface uplift above the slab for
a model with a lighter orogenic lower crust (Figure
3c). The uplift in this second model is explained by
the effect of the positive buoyancy of the thickened
crust, which overcomes the effect of negative buoyancy
of the delaminated lithospheric mantle. We therefore
show that the density of the lower crust also has a
significant influence on the dynamic topography response
related to delamination.
Figure 3: Predicted dynamic topography
(a, c) and density distribution (b, d) after 15 Ma
of evolution of two models with ‘soft sediments’ upper
layer. The model displayed to the left (a, b) has and
orogenic lower-crust density of 3050 kg/m3 (same
value as the Reference Model) and the model displayed
to the right (c, d) has an orogenic lower-crust density
of 2950 kg/m3. Click here or
on figure for enlargement.
To mimic the evolution of a post slab break-off scenario,
we perform a model with an initial setup consisting
of a flat crust with a standard value of lower crust
density (2950 kg/m3) and including a region of thickened
lithospheric mantle (to mimic a remnant portion of
slab). The evolution is similar to previous model (compare
Figure 4 a-b with Figure 2e-f and Figure 4c-d with
Figure 3c-d), but evolves faster because the area occupied
by the crustal root in previous models is now occupied
by denser lithospheric mantle. The evolution predicted
with this model highlights that, provided there
is sufficient negative buoyancy, a thickened low-viscosity
layer (represented by the lower crust) is not needed
to obtain delamination. We obtain the same
pattern of crustal thickening/thinning associated with
the migrating delamination point. In contrast, the
topographic response is very different (Figure 4),
as uplift is not predicted in any part of the modeled
section. The high negative predicted isostatic topography
(Figure 4a) results from the strong mass excess in
the lithospheric mantle imposed in this model. Similarly,
the equivalent model including a layer of ‘soft
sediments’ also predicts surface subsidence for
the same area above the delaminated lithospheric mantle
(Figure 4c-d).
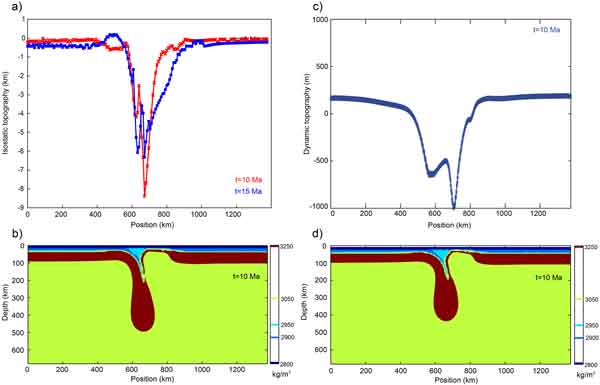
Figure 4: Model-predicted local isostatic topography
(a) after 10 and 15 Ma of evolution, and density distribution
after 10 Ma (b) for a model with a flat geometry of
the crust. Predicted dynamic topography (c) and density
distribution (d) after 10 Ma of evolution for a model
with the same configuration but including a ‘soft
sediments’ upper layer. Click here or
on figure for enlargement.
According to the models presented here, there
is no specific characteristic pattern of topography
changes associated with delamination, but changes
result from the interplay between highly variable
factors, such as slab sinking velocity,
asthenospheric upwelling and changes in crustal thickness.
Therefore, caution must be taken when possible delamination
processes are inferred only on the basis of topographic
evolution.
References
-
Gögüs, O.H, Pysklywec,
R.N. (2008), Near-surface diagnostics of dripping
or delaminating lithosphere, Journal
of Geophysical Research, 113,
B11404, doi:10.1029/2007JB005123
-
Morency, C.Y., Doin, M.-P.
(2004), Numerical simulations of the mantle lithosphere
delamination. Journal
of Geophysical Research, 109,
B03410, doi: 10.1029/2003JB002414.
-
-
Schott, B.Y., Schmeling, H.
(1998), Delamination and detachment of a lithospheric
root. Tectonophysics, 296,
225-247.
-
Valera,
J.L., Negredo, A.M., Villaseñor,
A.
(2008), Asymmetric delamination and convective
removal numerical modeling: Comparison with evolutionary
models for the Alboran Sea region, Pure and
Applied Geophysics, 165,
1683–1706, doi:10.1007/s00024-008-0395-8
last updated 18th
October, 2011 |


