 |
Formation of the North-South Seismic Zone and Emeishan large igneous province in Central China: Insights from P-wave teleseismic tomography |
Chuansong He1,2 & M. Santosh3,4
1Institute of Geophysics, CEA, Beijing 100081, China; hechuansong@aliyun.co
2Key Laboratory of Continental Collision and Plateau Uplift, Institute of Tibetan Plateau Research, Chinese Academy of Sciences, Beijing 100101, China
3School of Earth Sciences and Resources, China University of Geosciences Beijing, 29 Xueyuan Road, Beijing 100083, China; m.santosh@adelaide.edu.au
4Department of Earth Sciences, School of Physical Sciences, The University of Adelaide, SA 5005, Australia
.
This webpage is a summary of: He, C. and Santosh, M., 2020. Formation of the North–South Seismic Zone and Emeishan Large Igneous Province in Central China: Insights from P-Wave Teleseismic Tomography. Bull. seismol. Soc. Am., 110(6): 3064-3076.
.
Background
The regions surrounding the North-South Seismic Zone (NSSZ – Figure 1) in China witnessed multistage assembly of different crustal blocks during the Palaeozoic and Mesozoic. They were involved in the Caledonian Orogeny (Xu et al., 2006), Indosinian Orogeny, and Himalayan Orogeny (Replumaz et al., 2010), leading to extensive crustal compression and thickening (Tapponnier et al., 2001). During the Cenozoic (at approximately 55 Ma), collision between the Indian and Eurasian plates along the Neo-Tethyan suture (Liang et al., 2018; Gao et al., 2019) led to crustal deformation in the Alashan, Qilian, Qaidam, and Songpan-Ganzi blocks and significant eastward extrusion (Tapponnier et al., 2001).
.
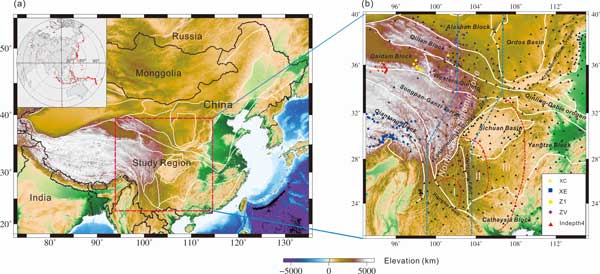
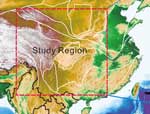
Figure 1. Map of the study region. (a) Map showing geological units and tectonic framework with inset showing earthquakes (red dots) used in the teleseismic tomography. (b) Map showing seismic stations (different colored symbols). I, II and III, bounded by red dotted lines, are the inner-, intermediate- and outer zones of the ELIP, respectively. Blue dotted lines indicate the North-South Seismic Zone. White solid lines indicate the boundaries of the geological units. Click here or on Figure for enlargement.
The NSSZ is thus located in a core region where multiple crustal blocks amalgamated and collided (Zhang, 2013; He et al., 2014) (Figure 1), It also marks an important boundary that divides mainland China into highlands in the west and lowlands in the east (Zhang, 2013). Documented historical earthquakes show that more than one-third of strong earthquakes (M>7) in China occurred in this area (Zhang et al., 2003; Deng et al., 2003), and it is thus a region of high seismic hazard with devastating earthquakes (Zhang et al., 2003; Deng et al., 2003). The unstable and distinctive nature of the NSSZ has therefore attracted much geological and geophysical attention.
The Permian-Triassic Emeishan large igneous province (ELIP – Chung & Jahn, 1995) is located in the southern part of the NSSZ, and is divided into 3 zones based on the distribution of magmatic units. These are the inner, intermediate, and outer zones (Ali et al., 2010; Xu et al., 2004) (Figure 1). It is widely assumed that an upwelling mantle plume in the later Permian led to formation of the ELIP (e.g., Ali et al., 2010). However, the relationship between an upwelling mantle plume and the ELIP remains controversial.
Our study
In our study, we collected a large set of teleseismic data on permanent and temporary seismic stations in the NSSZ and nearby regions. We designed a broad, detailed P-wave teleseismic tomography inversion in order to characterize the regional deep structure in the area and investigate the structure of the NSSZ and the origin of the ELIP (Figure 1).
We used an efficient 3-D ray-tracing technique to calculate the ray paths and theoretical travel-times (Zhao et al., 1992, 1994), and the conjugate-gradient algorithm of Paige & Saunders (1982) to determine the large and sparse system of linear equations. Based on the 50 km average distance between the seismic stations, a 1° lateral grid and 50, 100, 200, 300, 400, 500, 600, 700 and 800 km vertical grids were adopted. To remove the effect of crustal heterogeneity, crustal correction was performed for a 50 km crustal thickness (Jiang et al., 2009, 2015) using the CRUST1.0 model (Laske et al., 2012). The tomography code was provided by Prof. D. Zhao.
We used 585 teleseismic events recorded by 513 permanent seismic stations (China Earthquake Networks, 2007-2014, region: 21º-40 ºN, 93º-115ºE) as well as data from temporary seismic stations within the study region, including the Tibetan Plateau Broadband Experiment (XC, 3 stations, 1991-1992, region: 29.77º-36.20ºN, 93.91º-97.02ºE), the Namche Barwa Experiment (XE, 60 temporary stations, Sol et al., 2007, region: 35.35º-36.27ºN, 93.45º -95.27ºE), and the Northeast Tibet Seismic Experiment (ZV, 36 stations, 2008-2010, region: 32.45º-38.89ºN, 99.44º-103.62ºE; Z1, 7 stations, 2006-2007, region: 35.58º-36.76ºN, 97.79º-101.22ºE) (Figure 1, right panel). The epicentral distances of each station-event pair range between 30° and 85° and events had magnitudes larger than 6.0 (Figure 1, left panel, inset). Each event was recorded on an average of 145 seismic stations. Raw waveforms with bandpass filtering between 0.3 and 3 Hz were cut 15 s before and 50 s after the first P-wave arrival. Time-domain cross-correlation was used to select 89326 P-wave travel-time arrivals (VanDecar & Crosson, 1990). The inversion was limited to arrivals with -3 s to +3 s residuals.
Results
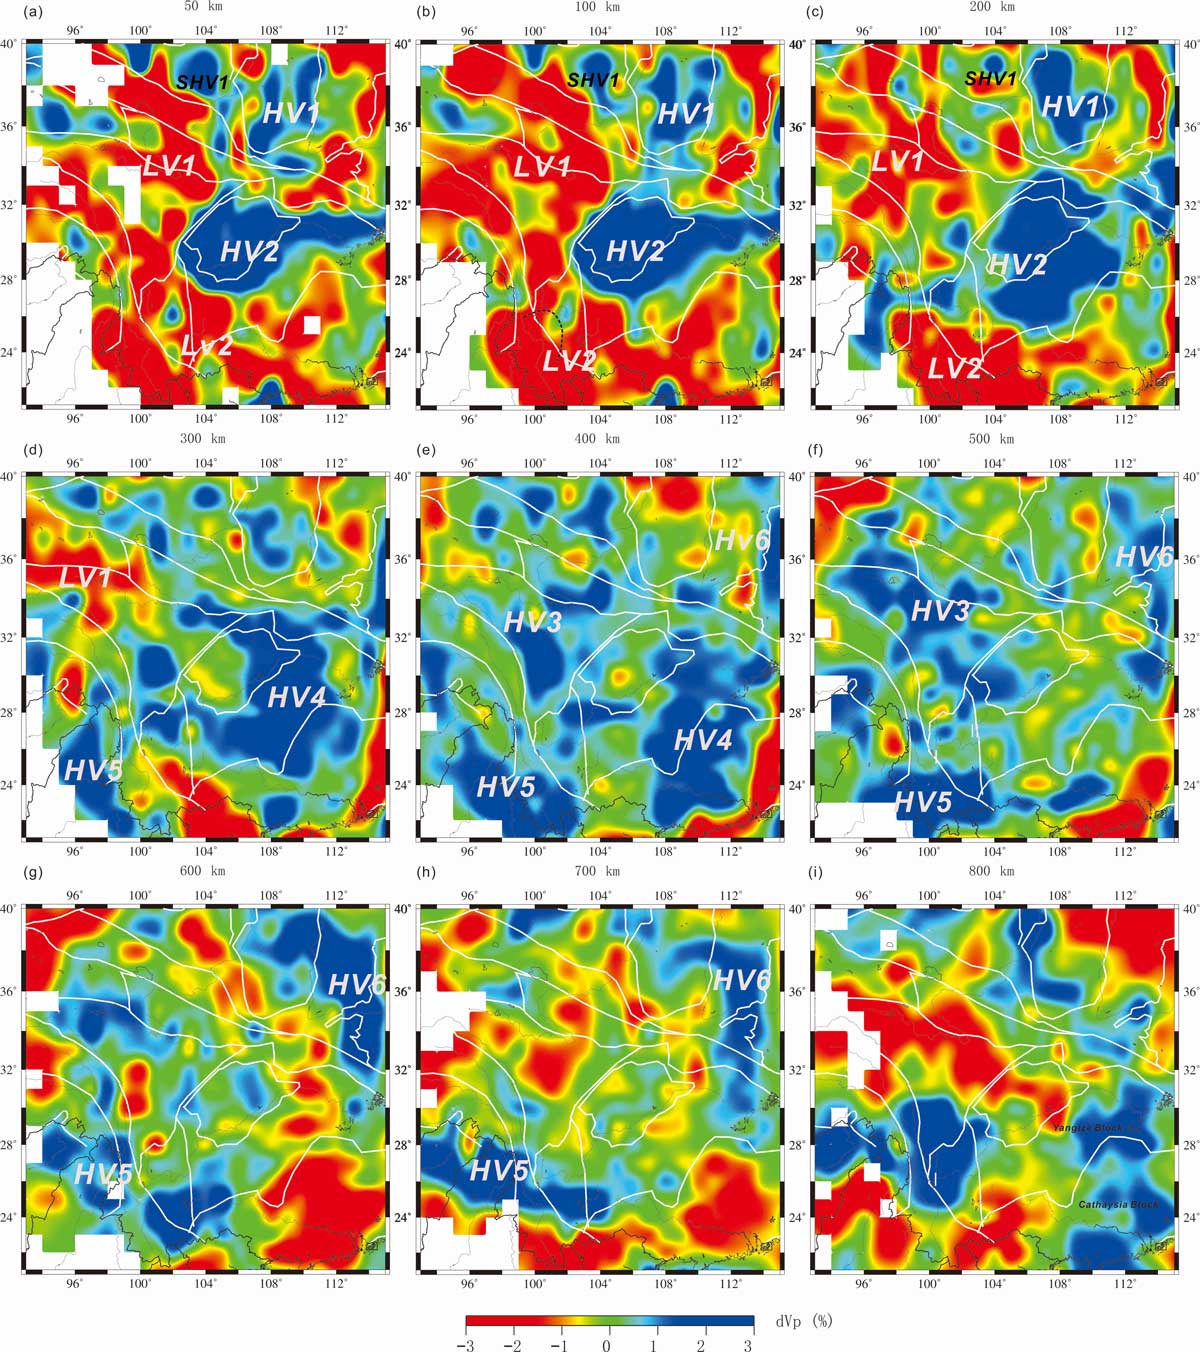
The results are shown in Figure 2. High-velocity (HV) structures HV1 and HV2 underlie the Ordos and Sichuan Basins at 50, 100 and 200 km depths, respectively. Low-velocity (LV) structure LV1 occurs in the western part of the Longmenshan Orogenic Belt (Figure 2), and LV2 underlies the southern part of the Sichuan Basin.
.
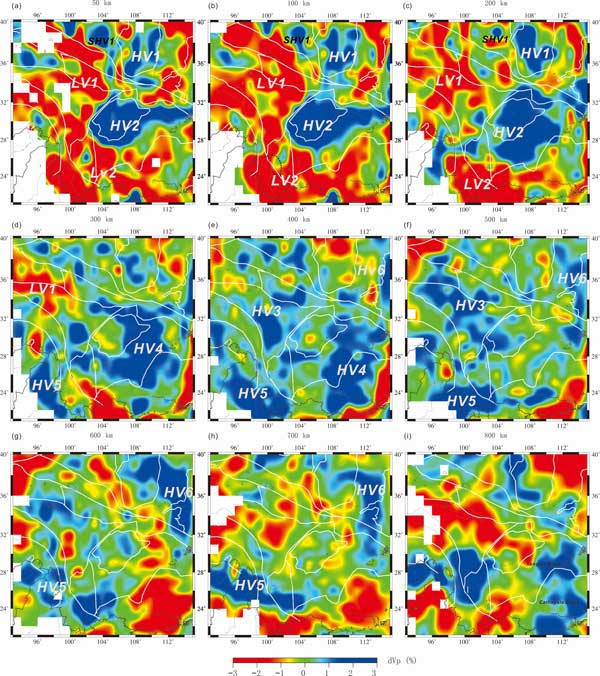
Figure 2. P-wave velocity perturbations at 50, 100, 200, 300, 400, 500, 600, 700 and 800 km depth sections relative to the IASP91 1D velocity model. White: regions where recovery from the input velocity model is below 20%. LV: low-velocity anomaly. HV: high-velocity anomaly. SHV: small-scale high-velocity anomaly Click here or on Figure for enlargement.
At depths of 300 and 400 km, HV4 underlies the Yangtze Block and Cathaysia Block. At depths of 400 and 500 km, HV3 underlies the Songpan-Ganzi Block. At depths of 400-700 km, HV5 and HV6 underlie the southeastern part and the eastern margin of the study region, respectively.
Figure 3 shows east-west cross sections. In the northern part of the NSSZ, the western section is underlain by a low-velocity structure (LV1) and the eastern part by a high-velocity structure (SHV1 or HV1). HV1 and SHV1 underlie the Ordos Basin and Alashan Block, respectively, and might represent the lithospheric roots of these blocks. SHV2, SHV3 and SHV4 lie in the upper mantle at depths of 300-700 km. We interpret HV6 as a subducted plate tilted from east to west.
.
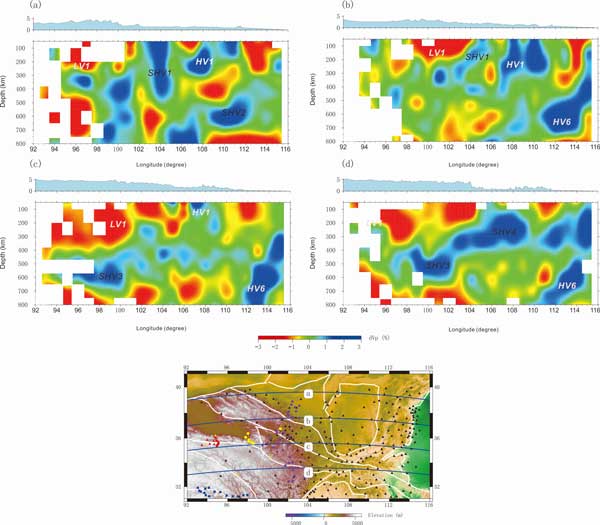
Figure 3. Profiles of P-wave velocity perturbations relative to the IASP91 1D velocity model in the northern part of the NSSZ. 102º -106º: northern part of the NSSZ. Top panel of each figure indicates elevation across different profile. The profile location is shown in the lower panel. Other features as for Figures 1 and 2. Click here or on Figure for enlargement.
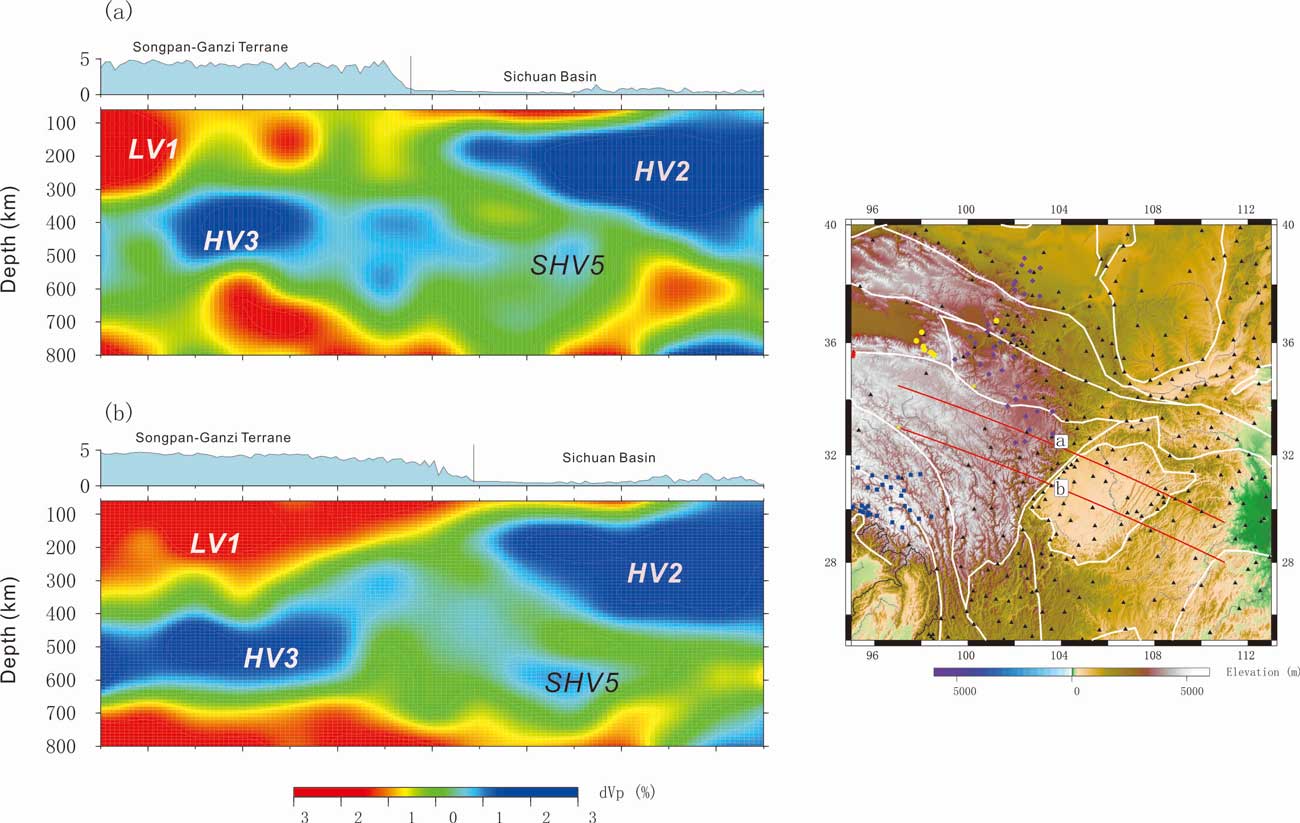
Previous tomographic analyses have identified HV1 and SHV1 as well as high-velocity anomalies (SHV2, SHV3 and SHV4) in the upper mantle (He & Santosh, 2017b), consistent with the tomographic results presented here (Figure 3). A previous study also defined a high-velocity structure beneath the Alashan Block (He & Santosh, 2017b), but did not reveal a clear lithospheric root for the Alashan Block. As shown in Figure 4, the Longmenshan Orogenic Belt marks the boundary between the LV1 and HV2 structures. HV3 underlies the Songpan-Ganzi Block, and SHV5 underlies the Sichuan Basin, consistent with the findings of previous study (He et al., 2019).
.
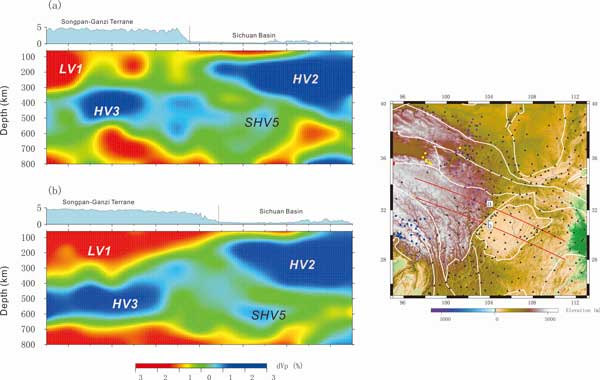
Figure 4. Profiles of P-wave velocity perturbations relative to the IASP91 1D velocity model across the Longmenshan Orogenic Belt. Vertical lines: Longmenshan Orogenic Belt. The profile locations are shown in the lower panel. Other features as for Figure 3. Click here or on Figure for enlargement.
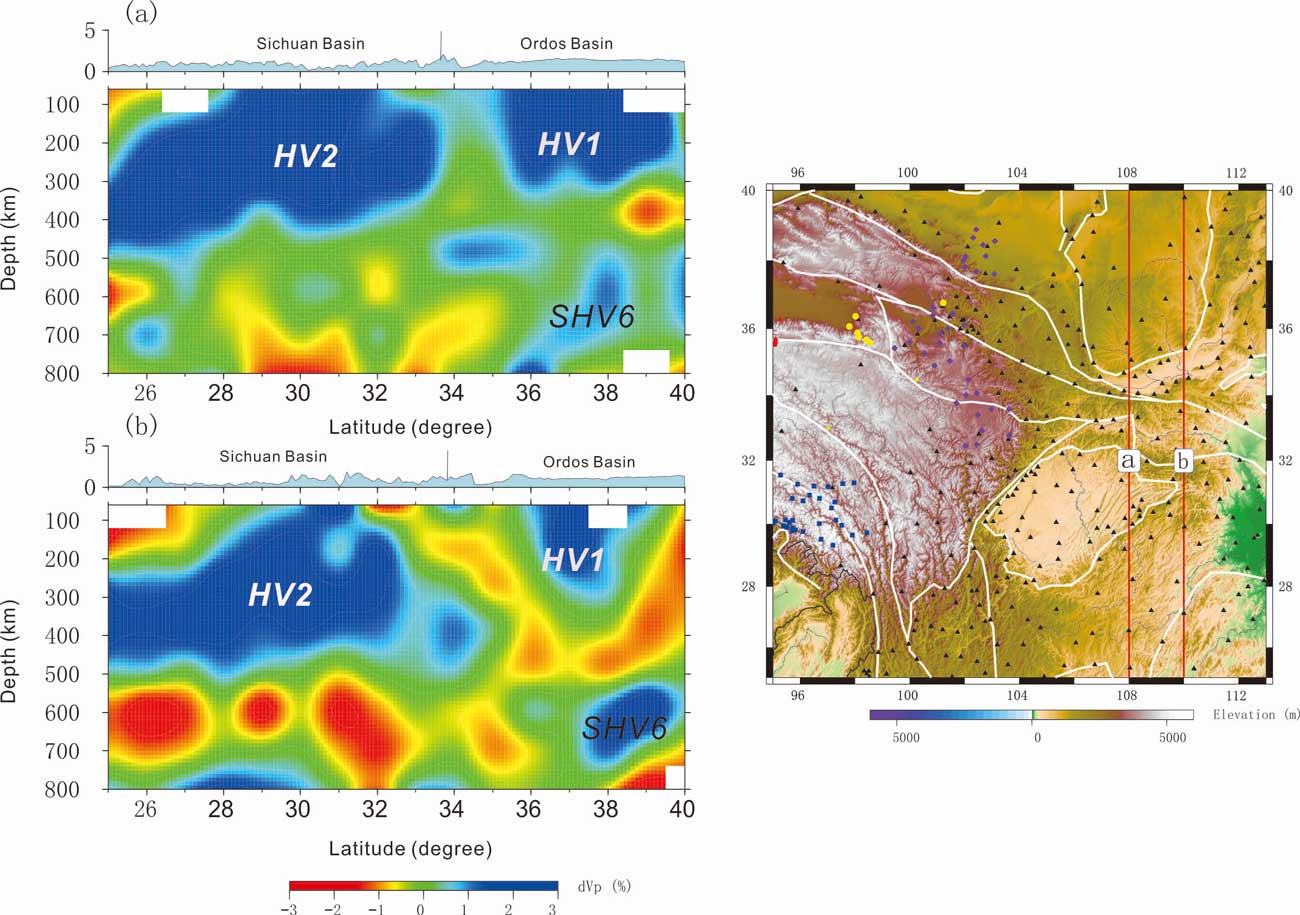
In Figure 5, HV1 and HV2 underlie the Ordos Basin and Sichuan Basin, respectively. SHV6 is identified under the Ordos Basin. However, SHV6 is larger than SHV5 (Figure 4, Figure 5), and the thickness of HV2 is greater than that of HV1. This is also consistent with previous results (He et al., 2019).
.

Figure 5. Profiles of P-wave velocity perturbations relative to the IASP91 1D velocity model across the Ordos and Sichuan basins. The profile location is shown in the left panel. Other features as for Figure 3. Click here or on Figure for enlargement.
In Figure 6, HV2 underlies the Sichuan Basin and LV2 is found under the Yangtze and Cathaysia blocks. HV4 underlies the southern part of the study region. LV2 occurs in the upper mantle and is not rooted in the lower mantle. HV5 resembles a subducted plate. Previous tomographic studies have also revealed a similar velocity structure in this area (He & Santosh, 2017a).
.
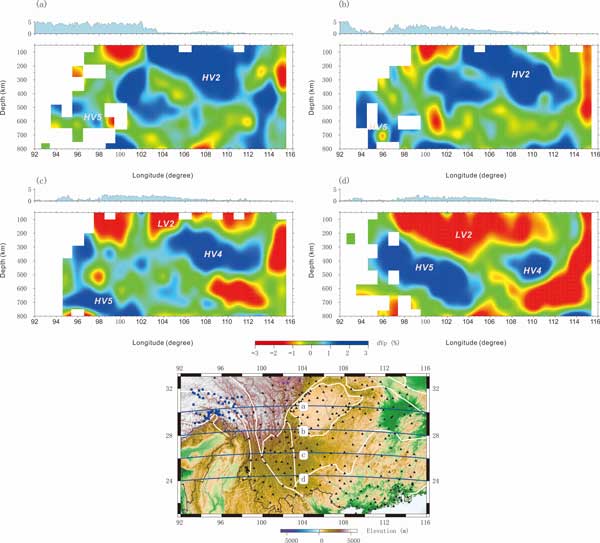
Figure 6. Profiles of P-wave velocity perturbations relative to the IASP91 1D velocity model across the southern part of the NSSZ and ELIP. Other features as for Figure 3. Click here or on Figure for enlargement.
Interpretation
Our results reveal large high-velocity anomalies beneath the Songpan-Ganzi Block and the South China Block, possibly representing large-scale lithospheric delamination. Low-velocity structures occur at 50 to 200 km depths in the western and southern parts of the NSSZ, suggesting upwelling asthenosphere induced by delamination and the absence of a rigid lithosphere.
Two high-velocity structures beneath the Sichuan Basin and the Alashan Block may represent the lithospheric roots of these structures. These rigid lithospheric roots possibly obstructed eastward extrusion of the Tibetan Plateau and led to stress accumulation and release, i.e. earthquakes in the Longmenshan Orogenic Belt and the northern part of the NSSZ. Due to this obstruction, eastward extrusion was redirected south-eastward to Yunnan in the southern part of the NSSZ, leading to stress accumulation and release causing earthquakes along the Honghe and Xiaojiang Faults.
A high-velocity structure with a subducted slab-like appearance may represent vestiges of the Paleo-Tethys Ocean which subducted beneath the ELIP and initiated large-scale mantle return flow or mantle upwelling, contributing to the formation of the ELIP.
Conclusions
Large-scale delamination generated by the collision and amalgamation of multiple blocks during the Palaeozoic to Mesozoic may have been influential in the NSSZ and surrounding regions. This might have been accompanied by mantle upwelling, which filled voids formed by delamination.
The western and southern parts of the study region are underlain by two large low-velocity structures at depths of 50-200 km, which indicate the absence of the rigid lithosphere in these areas. This may have facilitated the easy eastward extrusion of the Tibetan Plateau and south-eastward redirection of the eastward extrusion. Eastward extrusion is obstructed not only by the lithospheric root of the Sichuan and Ordos basins but also by the lithospheric root of the Alashan Block, which result in stress accumulation and release (earthquakes) in the Longmenshan area and the northern part of the NSSZ. In the southern part of the NSSZ, eastward extrusion might be redirected south-eastward along strike-slip faults, such as the Honghe and Xiaojiang faults, which results in stress accumulation and release (earthquakes) along these faults.
Our study indicates that the ELIP was generated by mantle upwelling due to delamination and the mantle return flow induced by the subducted slab of the Paleo-Tethys Oceanic lithosphere during the Permian-Mesozoic and not by an upwelling mantle plume rooted in the core-mantle boundary.
References
-
Ali, J. R., J. G. Fitton, and C. Herzberg (2010). Emeishan large igneous province (SW China) and the mantle-plume up-doming hypothesis, J. Geol. Soc. Lond. 167, no. 5, 953-959, doi:10.1144/0016-76492009-129.
-
Chung, S. L., and B. M. Jahn (1995). Plume-lithosphere interaction in generation of the Emeishan flood basalts at the Permian-Triassic boundary, Geology 23, no.10, 889-892, doi:10.1130/0091-7613(1995)023<0889:PLIIGO>2.3.CO;2.
-
Deng, Q., P. Zhang, Y. Ran, X. Yang, W. Min, and Q. Chu (2003). Basic characteristics of active tectonics of China, Sci. China Ser. D 46, no. 4, 356-372, doi:10.1360/03yd9032.
-
Gao, Y., L. Chen, X. Wang, and Y. Ai (2019). Complex lithospheric deformation in eastern and northeastern Tibet From shear wave splitting observations and its geodynamic implications, J. Geophys. Res. 124, no. 10, 10,331-10,346. https://doi.org/10.1029/2018JB017081.
-
He, C. S., S. W. Dong, and Y. H. Wang (2019). Lithospheric delamination and upwelling asthenosphere in the Longmenshan area: insight from a teleseismic P-wave tomography, Sci. Rep. 9, 6967, doi:10.1038/s41598-019-43476-0.
-
He, C. S., M. Santosh, J. P. Wu, and X. H. Chen (2014). Plume or no plume: Emeishan Large Igneous Province in Southwest China revisited from receiver function analysis, Phys. Earth Planet. Int. 232, 72-78, doi:10.1016/j.pepi.2014.04.004.
-
He, C. S., and M. Santosh (2017a). Mantle roots of the Emeishan plume: An evaluation based on teleseismic P-wave tomography, Solid Earth 8, no. 6, 1141-1151, doi:10.5194/se-2017-17.
-
He, C. S., and M. Santosh (2017b). Intraplate earthquakes and their link with mantle dynamics: Insights from P-wave teleseismic tomography along the northern part of the North–South Tectonic Zone in China, C. R. Geosci. 349, no. 3, 96-105, doi:10.1016/j.crte.2017.04.002.
-
Jiang, G. M., D. Zhao, and G. B. Zhang (2009). Crustal correction in teleseismic tomography and its application, Chin. J. Geophys. 52, 1508–1514, doi: 10.3969/j.issn.0001-5733.2009.06.012.
-
Jiang,G.M.,G.B.Zhang,D.Zhao,Q.T.Lü,H.Y.Li,andX.F.Li (2015). Mantle dynamics and Cretaceous magmatism in east- central China: Insight from teleseismic tomograms, Tectonophysics 664, 256–268, doi: 10.1016/j.tecto.2015.09.019.
-
Laske, G., G. Masters, Z. Ma, and M. E. Pasyanos (2012). CRUST1.0: An updated global model of Earth’s crust, Geophys. Res. Abstr. 14, EGU2012-37431.
-
Liang, M., Y. Ran, H. Wang, Y. Li, and S. Gao (2018). A possible tectonic response between the Qingchuan fault and the Beichuan-Yingxiu fault of the Longmen Shan fault zone? Evidence from geologic observations by paleoseismic trenching and radiocarbon dating. Tectonics, 37, no. 10, 4086-4096. https://doi.org/10.1029/2017TC004949.
-
Paige, C. C., and M. A. Saunders (1982). LSQR: An algorithm for sparse linear equations and spare least squares, ACM Trans. Math. Software 8, 43–71, doi: 10.1145/355984.355989.
-
Replumaz, A., A. M. Negredo, S. Guillot, and A. Villaseñor (2010). Multiple episodes of continental subduction during India/Asia convergence: insight from seismic tomography and tectonic reconstruction, Tectonophysics 483, nos. 1/2, 125-134, doi:10.1016/j.tecto.2009.10.007.
-
Sol, S., A. Meltzer, R. Burgmann, R. D. van der Hilst, R. King, Z. Chen, P. O. Koons, E. Lev, Y. P. Liu, P. K. Zeitler, et al. (2007). Geodynamics of the southern Tibetan plateau from seismic anisotropy and geodesy, Geology 35, 563–566, doi: 10.1130/ G23408A.1.
-
Tapponnier, P., Z. Xu, F. Roger, B. Meyer, N. Arnaud, G. Wittlinger, and J. Yang (2001). Oblique stepwise rise and growth of the Tibet plateau, Science 294, no. 5547, 1671-1677, doi:10.1126/science.105978.
-
VanDecar, C., and S. Crosson (1990). Determination of teleseismic relative phase arrival times using multi-channel cross-correlation and least squares, Bull. Seismol. Soc. Am. 80, 150–169.
-
Xu, Y. G., B. He, S. L. Chung, M. Menzies, and F. A. Frey (2004). Geologic, geochemical, and geophysical consequences of plume involvement in the Emeishan flood-basalt province, Geology 32, no. 10, 917-920, doi:10.1130/G20602.1.
-
Xu, Z. Q., J. S. Yang, C. L. Wu, and H. B. Li (2006). Timing and mechanism of formation and exhumation of the Northern Qaidam ultrahigh-pressure metamorphic belt, J Asian Earth Sci.28, nos. 2/3,160-173, doi:10.1016/j.jseaes.2005.09.016.
-
Zhang, P. Z. ( 2013).A review on active tectonics and deep crustal processes of the Western Sichuan region, eastern margin of the Tibetan Plateau, Tectonophysics 584, 7-22, doi:10.1016/j.tecto.2012.02.021.
-
Zhang, P. Z., Q. Deng, G. Zhang, J. Ma, and W.Gan (2003). Active tectonic blocks and strong earthquakes in continental China, Sci. China Ser. D 33, 13-24 (Suppl.), doi:10.1360/03dz0002.
-
Zhao, D., A. Hasegawa, and S. Horiuchi (1992). Tomographic imaging of P- and S-wave velocity structure beneath northeastern Japan, J. Geophys. Res. 97, 19,909–19,928, doi: 10.1029/92JB00603.
-
Zhao, D., A. Hasegawa, and H. Kanamori (1994). Deep structure of Japan subduction zones as derived from local, regional, and tele- seismic events, J. Geophys. Res. 99, 22,313–22,329, doi: 10.1029/94JB01149.
last updated 27th January, 2021 |