 |
North Atlantic geoid high, volcanism and glaciations |
Eugenio
Carminati & Carlo Doglioni
Dipartimento
di Scienze della Terra, Università La Sapienza,
Roma, Italy
eugenio.carminati@uniroma1.it & carlo.doglioni@uniroma1.it
Summary
Shallow topography, a geoid high and
intense volcanism on the northern Mid Atlantic Ridge
are interpreted as enhanced by the loading on the adjacent
continents by ice caps during upper Cenozoic glaciations.
The load of ice packs on the continental lithospheres
of North America and northern Europe generated radial
mantle flow at depth. In our model, these currents,
where flowing from west and east, faced each other
below the northern Atlantic, joining together and upwelling.
Numerical modeling of this process supports the development
of dynamic topography leading to uplift of the sea-floor
and inducing a regional geoid high. The upper mantle
rises to a few kilometres shallower than average,
partly as a result of being mechanically lifted by
the lower mantle (Figure 1). This may have contributed
to greater asthenospheric melting, and to ridge centered
excess magmatism, as observed in the Northern Atlantic.

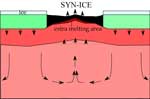
Figure 1. The tilted car simulates
the uplift mechanism of the upper mantle in the North
Atlantic.
1. Introduction
The lithosphere generated by the mid-Atlantic
Ridge (MAR) east of Greenland underlies the youngest
(< 60
Ma) and narrowest part of the Atlantic Ocean. This
portion of the northern Atlantic shows three peculiar
characteristics:
-
It is about 1-3 km shallower
than the average mid-oceanic ridge (Figure 2a,
b);
-
It displays broad positive
gravity (> 30 mGal)
and geoid (> 50 m) anomalies (Figure 2c, d,
f);
-
It is the locus of anomalously
great magmatic productivity, resulting in the thickest
oceanic crust found along the entire MAR, being
up to about 40 km thick beneath Iceland (Kaban
et al., 2002). The thickness
of the Cretaceous-Early Cenozoic (pre-glaciations)
oceanic crust in the northern Atlantic is 4-6 km
in average (e.g., Shillington et al.,
2006).
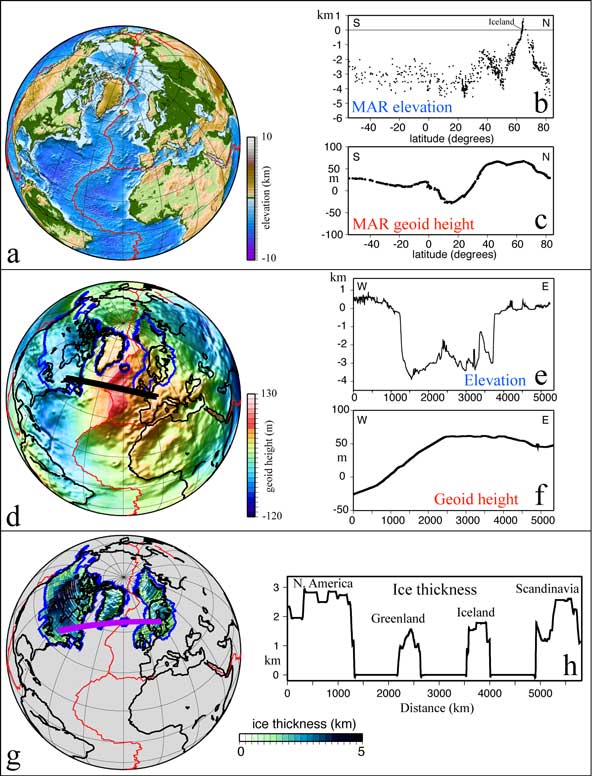
Figure 2: a) Topography (data after ETOPO1);
b) Elevation of the MAR. The bathymetry along the MAR
shows a high in the northern Atlantic which is limited
not only to the Iceland area but it extends ca 20° northward
and 40° southward; c) Geoid anomaly along the
MAR (data after the EGM96
model);
d) Geoid height. The north Atlantic geoid high is
located between the North American and Scandinavian
ice bodies; e) topography-bathymetry along the cross-section
on the map at left; f) geoid height along the same
section; The blue curves in panel d) show the borders
of the ice bodies according to ICE-5G. The geoid is
shallower along the eastern flank of MAR and the crest
of the anomaly is offset to the east of the oceanic
ridge. g) Thickness in map, and h) cross-section in
purple of the ice cap at the last glacial maximum (21
ka BP; data after the ICE-5G model; Peltier,
2004). Mid-ocean ridges are shown as red lines. The
purple great circle in panel g) shows the trace of
the modeled profile of Figure 4.
Several papers attribute these features to a mantle
plume (e.g., Vink, 1984). However,
the deep plume hypothesis has been questioned on many
grounds (e.g., Foulger & Anderson, 2005)
including the persistence of magmatism on the westerly
moving ridge, giving trails of volcanic productivity
both west and east of Iceland, the absence of evidence
for high temperature, and the presence of hydrous mantle
lowering the melting point (Bonatti, 1990).
There is also no evidence from seismic tomography for
a plume in the lower mantle (Foulger et al.,
2001; Ritsema & Allen, 2003). Moreover,
the Icelandic geochemical signature is not restricted
to Iceland, but continues both north and south along
the MAR (Taylor et al., 1997).
Here we test numerically a model in which far field
superficial loading of the mantle by the ice caps in
North America and northern Europe can contribute to
the anomalous features of the North Atlantic (Figure
3), i.e., uplift of the north Atlantic mantle, the
geoid anomaly and a higher degree of melting due to
faster adiabatic decompression induced by mantle upwelling.
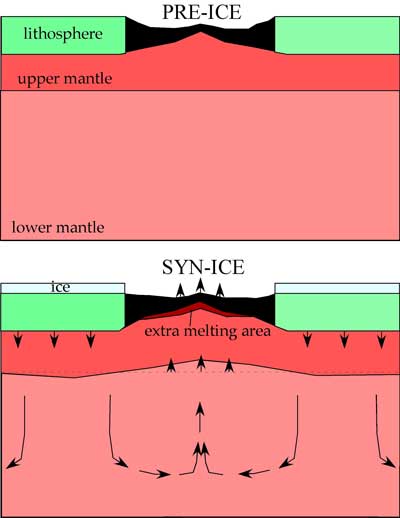
Figure 3: Model of the North Atlantic
uplift generated by the loading of the ice caps over
the adjacent continents. Melting occurs in the asthenosphere,
but it is facilitated by the upward pumping of the
deeper mantle. Hysteresis is required in order to maintain
the shallower depleted asthenosphere after melting.
The magmatic overproduction predicted by this model
represents another type of volcanism able to generate
trails, complementary to shear heating (Doglioni
et al., 2005; Anderson, 2010), extra
water in the mantle (Bonatti, 1990), and migrating
rifts. This provides another explanation for the excess
magmatism commonly attributed to plumes, illustrating
that such magmatism can have many origins, and reinforcing
evidence for their shallow nature.
2. Model description and results
Assuming Earth is a uniform viscous half-space, with
a cylindrical ice-load, it can be shown analytically
(e.g., Cathles, 1975) that the depth at which
the vertical displacement induced by ice loading/unloading
is 0.5, 0.2 or 0.1 x the surface value, and equal to
1.4R0, 2.5R0 and 3.3R0 (where R0 is the radius of the
cylinder; i.e., 825 km, 1474 km and 1815 km for the
Fennoscandian ice sheet, which has R0=550 km). Numerical
solutions have also shown that the ice cycles in the
Canadian region induced vertical motions exceeding
60° (6600 km) from the ice center (e.g., Cathles,
1975).
Here we test the combined effects
of the glacial cycles in North America and Europe on
regional mantle flow. The aim of our finite element
modeling, performed using COMSOL
3.5 software,
is to evaluate the velocity field induced within the
upper mantle by glaciation cycles rather than to reproduce
exactly the surface velocities. This allowed us to
adopt some major simplifying assumptions, such as two-dimensionality
(2D), neglecting the load due to water redistribution
during the ice formation and melting, and using a simplified
ice model.
The model adopts a 2D plane strain
approximation and includes lithosphere, upper and lower
mantle (Figure 4). All the layers are described by
a compressible linear viscoelastic (Maxwell) rheology.
The assumed elastic constants and viscosities are listed
in Table I. The elastic structure is consistent with
the PREM model (Dziewonski & Anderson,
1981) and the viscosities are consistent with values
normally used for glacial isostatic rebound modeling (e.g.,
Mitrovica & Peltier, 1993; Kaufmann & Lambeck,
2002). Gravity acceleration and density vary with depth
according to the PREM model. Gravity is applied as
a body force and the ice load as a boundary condition.
Ice thickness varies with time but is kept laterally
constant for each area. The model is run from 150 ka
BP to the present. The ice thickness is kept at zero
between 150 ka and 120 ka BP and is then linearly increased
to reach the maximum thickness at 105 ka BP. It is
then kept constant until 21 Ka BP. Between 21 Ka and
6 Ka BP the ice thickness is linearly decreased to
zero, with the exception of Greenland, where it is
decreased to 750 m. The maximum thicknesses is assumed
to vary regionally–2500 m for North America,
1300 m for Greenland, 2000 m for Scandinavia and 2000
m for Iceland (when applied). Such values are consistent
with Figure 2h, which shows maximum ice thicknesses
along the trace of the modeled section at 21 ka BP
according to the ICE-5G model (Peltier, 2004).
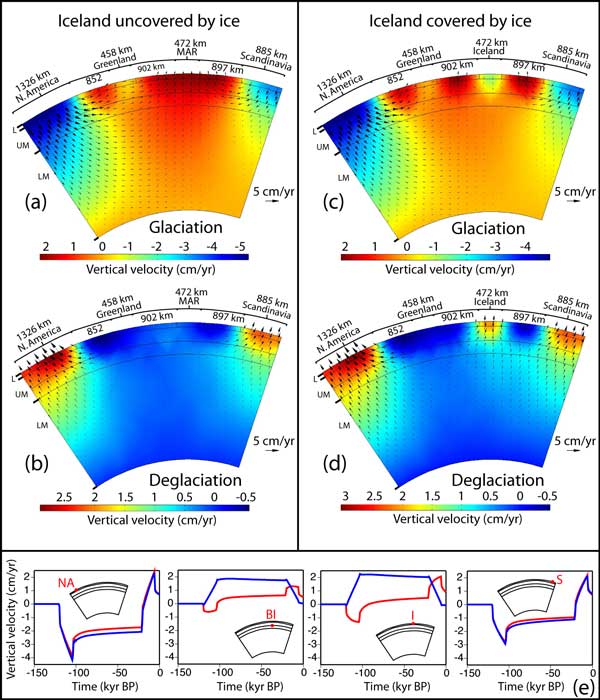
Figure 4: Vertical
velocities and velocity fields predicted by the models
immediately after the formation of the ice caps (105
ka BP, panels a and c) and soon after their melting
(6 ka BP, panels b and d). Panels a and b refer to
a model without ice during
the glacial period in the Iceland region, and panels
c and d to a model with Iceland affected
by ice. Panel e shows the vertical rates through time
at four different locations marked by the red dots
(NA, North America; BI, beneath Iceland; I, Iceland;
S, Scandinavia). Blue line is with Iceland unaffected
by ice, red line represents the case of Iceland covered
by ice. Click here or on figure for enlargement.
Table 1: Elastic and viscous parameters used in the
calculations.
Layer |
Poisson’s
ratio |
Young
Modulus (Pa) |
Viscosity
(Pa s) |
Depth
interval
(km) |
Lithosphere |
0.27 |
1.75e11 |
5e22 |
0-100 |
Upper
Mantle |
0.27 |
1.39e11 |
1e21 |
100-670 |
Lower
Mantle |
0.27 |
1.27e11 |
1e22 |
670-2890 |
The bottom of the model is fixed normally
to the boundary and is free to slip tangentially. Symmetry
conditions are imposed on the left and right boundaries.
This is reasonable since the tips of the modeled section
are located approximately at the center of the American
and Scandinavian ice masses. The model surface is left
free in areas unaffected by ice formation. We use a
set of ca. 3800 triangular elements. Modeling results
are shown for the time steps of 105 ka and 6 ka BP,
representative of the glaciation and deglaciation scenarios
respectively. Although no constraints are available
for past mantle velocity simulations, we are confident
that the patterns and the order of magnitude of the
calculated velocities are realistic. This confidence
is justified by the positive match between simulated
and observed present-day vertical velocities for well-constrained
areas such as Scandinavia.
Two scenarios are modeled. In the first Iceland is
covered by ice during the glaciation, while in the
second Iceland is assumed to be ice-free. The first
model simulates the evolution in the transect of Figure
2, while the second simulates a section just north
or south of Iceland. Figure 4 shows the vertical velocities
and the velocity field predicted for the two scenarios.
Both scenarios indicate a convergence of velocity vectors
towards the Atlantic during formation of the ice cap,
with a prevalence of horizontal directions of motion.
Below Iceland and the surrounding Atlantic the velocity
vectors turn vertical with a general upwelling (rates
of up to 2 cm/a in the Iceland ice-free scenario).
In the Iceland-covered scenario, the upwelling is limited
to the Atlantic region with rates of less than 2 cm/a.
Below Iceland the lowermost upper mantle moves upward
slowly (< 0.5 cm/a), while the shallower upper mantle
moves downward, due to the Icelandic ice load. During
the same glaciation period, a downward flow at rates
of 2/4 cm/a is predicted for North America and Scandinavia.
The velocity field is reversed during deglaciation,
with the mantle flowing downward and away from the
central Atlantic region and upward below Scandinavia
and North America. Figure 4e shows that development
of the velocity field associated to glaciation and
its reversal during deglaciation is fast, due to the
elastic component of rheology. Present-day rates, although
with lower magnitudes, show for the two scenarios velocity
patterns similar to those of Figure 4b and 4d. Thus
the dynamic topography attained during the glaciation
period has not been completely recovered, due to the
viscous component of the lithosphere and mantle rheology.
The models show that the ice load induces an upward
flow below the MAR generating dynamic topography consistent
with the geoid high measured in the region. The results
of the model that assumes Iceland free of ice allowed
us to predict, at 21 ka BP (i.e., just before the beginning
of deglaciation), a geoid anomaly of ca. 70 m for the
center of the Atlantic ocean (location I in Figure
4e). The geoid anomaly was calculated as:
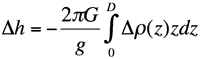
(Turcotte & Schubert,
2002), where Dh is
the geoid anomaly, g is the gravity acceleration, Dr(z) is
the anomalous density at depth z, D is
the compensation depth (chosen as the bottom of our
model) and G is the Newtonian constant (6.67x10¹¹
m3 kg-1 m-2). Although
this calculation is just a rough estimate, since it
includes only the upward motion below the MAR and does
not include crust formation, mantle partial melting
and other thermal processes, it is compatible with
the present day anomaly of the region (ca. 60 m; Figure
2), showing that present-day geoid anomaly and high
topography of the region are remnants of the glaciation.
Moreover, mantle upwelling may enhance mantle partial
melting and explain, at least in part, the anomalously
intense magmatic activity of the region. Assuming an
average 7-10% melt of the asthenosphere (e.g.,
Langmuir & Forsyth, 2007) under the northern
MAR, the cumulative uplift of ca. 2 km of the mantle
during the glaciations would increase the melting by
a few percent (depending on water content, initial
mantle composition and temperature, spreading rate,
etc.), producing a larger volume of magma delivered
to the surface.
3. Discussion and conclusions
Ice loading/unloading can have a regional impact on
mantle flow velocities (Figure 3). The MAR shallow
bathymetry (Figure 2) and the geoid regional positive
anomaly of the northern Atlantic (Tapley et al.,
2005) are in an area intermediate between the ice caps
in north America and Europe during the last glaciation.
Moreover, the same area is occupied by the largest
volcanic province in the northern Atlantic. If our
model is correct, we speculate a glacio-eustatic Milankovitch
periodicity in north Atlantic magma production.
The oldest rocks in Iceland are ~ 15 Ma old (Hardarson
et al., 1997). The same authors noted chemical
variations of basalts, generated by a variably depleted
mantle. Iceland possibly emerged at that time or
later, and it experienced ice loading as well. The
time of the onset of glaciations in the northern
hemisphere is still debated. It has been shown how
the onset of glaciations in the northern hemisphere
is older (Eocene-Oligocene) than previously estimated
(Eldrett et al., 2007). Recent deep sea
drilling provided evidence for a middle Eocene initiation
of the icehouse of the Arctic area (Moran et
al., 2006).
Although we modeled a single ice cycle, the productivity
of magma over geological periods is expected to be
influenced by the superposition of several ice cycles
on the process of oceanic spreading. The remote loading
of ice can determine an upwelling of the mantle elsewhere,
generating larger volumes of melt due to mantle adiabatic
decompression below the ridge. Vice versa, the ice
load in a volcanic area (e.g., along the MAR
in Iceland) can locally buffer eruption, tuning the
frequency of magmatic delivery, and generating a lower
degree of melting and a longer residence time of melts
in the mantle. Our model predicts a relatively low
intensity of magmatism along the northern segment of
the MAR during the present interglacial period.
We note that the North Atlantic geoid height is presently
decreasing, while it is increasing on the adjacent
continental areas, as shown by the Grace project data
(e.g., Tapley et al., 2004). The decrease
of the geoid has been related to the melting of ice
in Greenland (Ramillien et al., 2006), but
it could also be related also to decreasing upwelling
beneath the northern MAR due to the absence of ice
caps on the continents. Conversely, continental areas
show an increase of the geoid because the mantle is
rising, recovering the subsidence previously generated
by the ice loading. When mantle rises and melts beneath
a ridge, it becomes lighter (Oxburgh & Parmentier,
1977). Therefore the process is possibly not entirely
reversible since the uplifted and depleted mantle cannot
be re-downwelled to its original position, by the down-flow
motion induced by deglaciation, because of the permanent
increase in buoyancy following melting.
During the time frame considered (say the last 20-30
Ma) we may expect about 180-250 oscillations associated
with the eccentricity of the Earth’s orbit, or
more than twice as many in the case of obliquity related
cycles. The model presented rather shows the effects
of only one single cycle of loading and unloading.
Assuming an irreversible component on each cycle, the
present geoid high would represent the sum of the all
episodes, a sort of vibration-generating hysteresis
in the uplift of the mantle.
In summary, we suggest that the ice caps on the continents
of the northern hemisphere generated flow in the underlying
mantle that converges in the northern Atlantic from
west and east, upwelling along the northern MAR. The
eastward offset of the geoid high relative to the MAR
could be due to a larger ice load on the northern American
continent, although we cannot neglect a contribution
from the relative eastward mantle flow implicit in
the notion of the westward drift of the lithosphere
(Crespi et al.,
2007), able to generate an
asymmetry of ocean ridges worldwide (Doglioni et
al., 2003; 2007; Panza et al.,
2010)
and possibly contributing to the vertical motion of
continents (Carminati et al.,
2009). This
model implies that the over production of magmatism
in the northern Atlantic could be sourced from shallow
depth in the asthenosphere, where mantle rises as a
result of pumping from deeper mantle flow.
References
-
Anderson, D.L., 2010, Hawaii,
Boundary Layers and Ambient Mantle--Geophysical
Constraints, Journal
of Petrology, doi: 10.1093/petrology/egq068.
-
Bonatti,
E. (1990), Not So Hot "Hot Spots" in
the Oceanic Mantle, Science, 250, 107-111.
-
-
-
Cathles, L.M. (1975), The viscosity of the
Earth's mantle Princeton, New Jersey, Princeton
University Press, 386 pp.
-
Crespi, M., Cuffaro, M.,
Doglioni, C., Giannone, F., and Riguzzi, F. (2007),
Space geodesy validation of the global lithospheric
flow. Geophys. J. Int., 168,
491-506, doi: 10.1111/j.1365-246X.2006.03226.x.
-
-
-
-
Dziewonski,
A. M., and D. L. Anderson (1981), Preliminary reference
Earth model, Phys. Earth Planet. Int., 25,
297–356.
-
Eldrett, J. S., I. C. Harding, P. A.
Wilson, E. Butler, and A. P. Roberts (2007), Continental
ice in Greenland during the Eocene and Oligocene, Nature, 446,
176-179.
-
Foulger, G. R., and D. L. Anderson (2005),
A cool model for the Iceland hotspot, J. Volc.
Geother. Res., 141,
1– 22.
-
Foulger, G. R., et al. (2001), Seismic
tomography shows that upwelling beneath Iceland is
confined to the upper mantle, Geophys. J. Int., 146,
504–530.
-
Gripp, A. E., and R. G. Gordon (2002),
Young tracks of hotspots and current plate Velocities, Geophys.
J. Int., 150, 321-361.
-
Hardarson,
B. S., J. G. Fitton, R. M. Ellam, M. S. Pringle
(1997), Rift relocation - a geochemical and geochronological
investigation of a palaeo-rift in northwest Iceland, Earth
Planet. Sci. Lett., 153,
181-196.
-
Kaban, M. K., O. G. Flóvenz, and G.
Pálmason
(2002), Nature of the crust-mantle transition
zone and the thermal state of the upper mantle
beneath Iceland from gravity modelling, Geophys.
J. Int., 149,
281-299.
-
Kaufmann, G., and K. Lambeck (2002), Glacial
isostatic adjustment and the radial viscosity profile
from inverse modeling, J. Geophys. Res., 107,
2280. doi:10.1029/2001JB000941.
-
Langmuir, C. H. and D. H. Forsyth
(2007), Mantle Melting Beneath Mid-Ocean ridges, Oceanography, 20,
1, 78-87.
-
Mitrovica, J. X., and W. R. Peltier (1993),
Constraints on mantle viscosity from relative sea
level variations in Hudson Bay, Geophys. J. Int., 19,
1185-1188.
-
Molnar, P., and J. Stock (1987), Relative
motions of hotspots in the Pacific, Atlantic, and
Indian oceans since Late Cretaceous time, Nature, 327,
587-591.
-
Moran, K. et al. (2006), The Cenozoic palaeoenvironment
of the Arctic Ocean, Nature, 441,
doi:10.1038/nature04800.
-
Oxburgh, E. R., and E. M.
Parmentier (1977), Compositional and density stratification
in oceanic lithosphere; causes and consequences, J.
Geol. Soc. London, 133/4,
343-355.
-
-
Peltier, W. R. (2004), Global glacial
isostasy and the surface of the ice-age Earth: the
ICE-5G (VM2) model and GRACE, Ann. Rev. Earth
Planet. Sci., 32,
111-149.
-
Ramillien, G., A. Lombard, A. Cazenave, E.
R. Ivins, M. Llubes, F. Remy, and R. Biancale (2006),
Interannual variations of the mass balance of the
Antarctica and Greenland ice sheets from GRACE, Glob.
Planet. Change, 53, 198-208.
-
Ritsema,
J., and R. M. Allen (2003). The elusive mantle
plume, Earth Planet. Sci. Lett., 207,
1-12.
-
Shillington, D. J., W. S. Holbrook,
H. J. A. Van Avendonk, B. E. Tucholke, J. R. Hopper,
K. E. Louden, H. C. Larsen, G. T. Nunes (2006),
Evidence for asymmetric nonvolcanic rifting and
slow incipient oceanic accretion from seismic reflection
data on the Newfoundland margin, J. Geophys.
Res., 111, B09402, doi:10.1029/2005JB003981.
-
Tapley, B. D., S. Bettadpur,
J. Ries, P. F. Thompson, M. M. Watkins (2004),
GRACE Measurements of Mass Variability in the Earth
System, Science, 305,
5683, 503-505.
-
Tapley, B. et al. (2005), GGM02 – An
improved Earth gravity field model from GRACE, J.
Geod., 79,
467–478.
-
Taylor, R. N., M. F. Thirlwall, B.
J. Murton, D. R. Hilton, and M. A. M. Gee (1997),
Isotopic constraints on the influence of the Icelandic
plume, Earth
Planet. Sci. Lett., 148,
El -E8.
-
Turcotte, D. L., and G. Schubert
(2002), Geodynamics. Cambridge University Press,
456 pp.
-
Vink, G. E. (1984), A hotspot model for Iceland and
the Voring plateau, J. Geophys. Res., 89,
9949-9959.
last updated 15th
September, 2011 |
