 |
Why is the
uplift and subsidence history of the Ontong Java
Plateau anomalous compared to other large igneous
provinces? |
Julie
Roberge1 and Paul
J. Wallace2
1Laboratorio
Universitario de Petrología, Instituto de Geofisica,
Universidad Nacional Autónoma de México
(UNAM), Coyoacan, 04510, Mexico, D.F. roberge@geologia.unam.mx
2Department of Geological Sciences, University
of Oregon, Eugene, OR 97403-1272, pwallace@uoregon.edu
This webpage is based on:
-
Roberge,
J., Wallace, P. J., White, R. V., and Coffin,
M. F., 2005, Anomalous uplift and subsidence
of the Ontong Java Plateau inferred from CO2
contents of submarine basaltic glasses. Geology,
33, 501-504.
-
Roberge,
J., White, R. V. and Wallace, P. J. , Volatiles
in submarine basaltic glasses from the Ontong
Java Plateau (ODP Leg 192): implications for
magmatic processes and source region compositions,
in: Origin
and Evolution of the Ontong Java Plateau,
Fitton J.G., Mahoney J.J., Wallace P.J.
and Saunders A.D., Eds., Geological Society
(London) Special Publication, 229,
239-257, 2004.
|
Overview
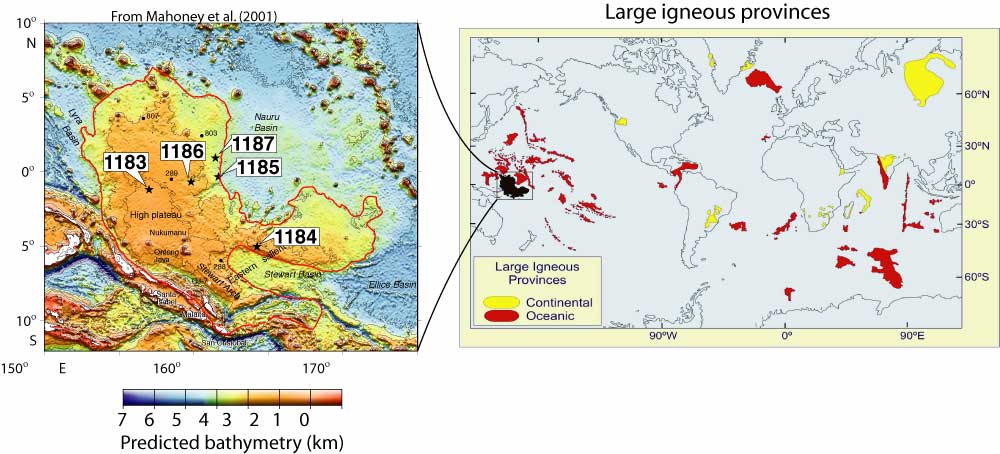
The Ontong Java Plateau
(OJP) in the western Pacific (Figure 1) is the largest
volcanic oceanic plateau and may represent the largest
magmatic event on Earth in the last 200 Ma. Relevant
statistics are:
- Age = Cretaceous (122 Ma)
- Volume = 40-45 million km3
- Area > 1.6 million km2
- The crest of the plateau is ~1700 m
below sea level, and elsewhere it is ~2-3 km deep.
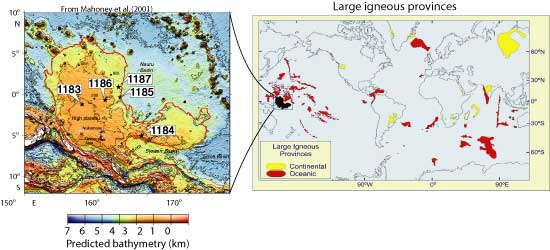
Figure 1: Location
of the Ontong Java Plateau in the western Pacific and
ETOPO5 bathymetric map of the Ontong Java Plateau showing
locations of Leg 192 drill sites (stars). Locations
of previous ODP and DSDP drill sites that reached basement
(small solid circles) are also shown. Depth contours
are in meters below sea level. Click here
or on figure for enlargement.
The OJP is anomalous
compared to other oceanic large igneous provinces such
as the Kerguelen plateau in that it never formed a subaerial
landmass and did not cause extinction (Figure 2) [Ed:
see also other pages on
Ontong Java].
Figure 2: Comparison
of OJP with other large igneous provinces. Click here
or on figure for enlargement.
Submarine basaltic glasses
preserve information on magmatic volatile contents (Figure
3). H2O and CO2 concentrations
can then be used to estimate paleo-eruption depths and
thus constrain better the uplift and subsidence history
of the OJP.
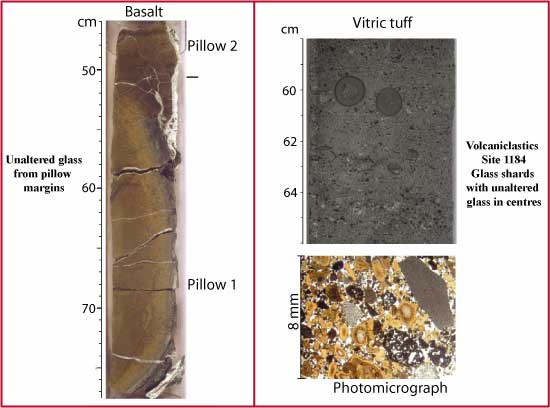
Figure 3: Example of
unaltered basaltic glass from pillow rims at sites 1183,
1185, 1186, 1187 (left), and glass in non-vesicular
glass shards in volcaniclastic rocks from site 1184
(right).
Water
in the mantle source region for Ontong Java Plateau
basaltic magmas?
During ODP Leg 192, five
widely spaced sites were drilled (Figure 1; Mahoney
et al., 2001). Unaltered glass from pillow
basalt rims at four locations (ODP Sites 1183, 1185,
1186, and 1187) and from non-vesicular glass shards
in volcaniclastic rocks at Site 1184 were analyzed for:
- H2O and CO2 using
Fourier Transform Infrared (FTIR) spectroscopy (Table
1), and
- for major elements using a Cameca SX-50
Electron Microprobe at University of Oregon.
Our results complement
previously published data for glasses recovered from
ODP Leg 130 Sites 803 and 807 (Michael,
1999). For consistency, we reanalyzed the
glasses from Sites 803 and 807 because we used a different
data reduction procedure for our CO2 analyses.
Our new analyses and data reduction procedure result
in CO2 values that are mostly 15 ppm (at
lower concentration) to 30 ppm (at higher concentration)
lower than those of Michael
(1999).
Table 1: Average dissolved
H2O and CO2 contents of submarine
basaltic glasses from the Ontong Java Plateau (OJP).
Note: H2O and
CO2 were analyzed by FTIR spectroscopy using
band assignments and absorption coefficients as described
in Roberge
et al.
(2004). Peak height measurements for CO2
were calculated using a peak fitting program (S. Newman,
unpublished). This method yields values for experimental
glasses (Dixon et al., 1995) that are comparable
to the reference-glass subtraction and hand-drawn background
method upon which the CO2 solubility relations
have been established (J. Dixon, written comm.)
The H2O and CO2 values reported
for each site are averages (± 2σ in parentheses)
of multiple glass chips (see Roberge
et al.,
2004, for complete data and analytical uncertainties).
Vapor saturation pressures were calculated using VolatileCalc
1.1 (Newman & Lowenstern, 2002). Uncertainties
(in parentheses) for saturation pressures, eruption
depths, and subsidence values are based on propagation
of 2σ uncertainties in the average H2O
and CO2 values. The subsidence uncertainties
also include uncertainties in depths of the samples
in the drill hole.
*Based on interpretation
that Site 1184 volcaniclastic rocks were erupted in
a shallow marine environment but deposited subaerially
(Thordarson, 2004).
An exciting discovery of Leg 192 was that basement at
Site 1187 and the upper group of flows at Site 1185
are composed of high-MgO, incompatible-element-poor
basalt that are unlike basalts found elsewhere on the
OJP (Figure 4). Relatively low K2O,
Na2O, and P2O5 in all
glasses suggest that OJP basaltic magmas formed by large
extents of melting. Low-MgO basalts can be derived
by fractionation at low to moderate pressure from parental
magmas similar to the high-MgO Site 1187 basalts.
Figure 4: Major element
compositions of Ontong Java Plateau basaltic glasses.
Data from Sites 803 and 807 and the island of Malaita
are from Michael
(1999). Lines show fractional crystallization paths
for a parental magma with 17.6 wt% MgO calculated as
described in the text. Crystallization of this parental
composition at pressures of 1 bar to 2 kbar can largely
reproduce the observed range of major element compositions.
Under these conditions, the crystallization sequence
is olivine, followed by olivine + plagioclase, followed
by olivine + plagioclase + clinopyroxene. Click here
or on figure for enlargement.
However, H2O
concentrations are similar in the two basalt types despite
the lower K2O and TiO2 of the
high-MgO glasses. To understand H2O
in mantle source regions it is useful to compare H2O/Ce
ratios because these elements have a similar incompatibility
to one another during mantle melting and fractional
crystallization (Michael, 1995). H2O/Ce
values for OJP basalt are 355-370 for high-MgO glasses
and 270 for low-MgO glasses (Figure 5). These
values are higher than most depleted and enriched MORB
(Michael, 1995). However, the H2O/Ce
values of all glasses may be elevated because of assimilation.
If uncontaminated OJP magmas have low Cl/K like other
mantle-derived magmas, then primary H2O/Ce
values may be as low as 125-140.
Figure 5: H2O/Ce
versus K/Ti for OJP basaltic glasses (left). Shown for
comparison are H2O/Ce ranges for MORB glasses
from various regions (MAR = Mid-Atlantic Ridge). Horizontal
black bar shows the H2O/Ce ratio estimated
as described in Roberge
et al. (2004) for uncontaminated OJP magmas. Click
here or on
figure for enlargement.
In addition, trace element
abundances demonstrate that OJP basaltic magmas formed
by large degrees of melting (Figure 6). However,
as previously stated, OJP basalts have low H2O,
similar to depleted MORB. Therefore the large
degrees of melting must have been caused by high melting
temperature (>1550°C).
Figure 6: Graph of
Nb vs. Zr showing the extent of melting required to
produce OJP basalts (from Fitton & Goddard, 2004).
Estimating
paleo-eruption depths
Vapor saturation pressures
were calculated for all sites and then converted into
eruption depths (1 bar = 10 m water depth) assuming
equilibrium solubility of H2O and CO2
at the time of quenching (Figures 7 and 8; Table 1).
As expected, glass shards from the volcaniclastic deposits
at Site 1184 have low vapor saturation pressures, indicating
an average quenching depth of 540 ± 210 m. Site
1183 glasses, which come from the shallowest water site
on the central high plateau, also have relatively low
vapor saturation pressures of 107 bars (1070 ±
90 m), whereas Sites 1185, 1186 and 1187 have saturation
pressures of 215 to 245 bars, yielding estimated eruption
depths of 2150 to 2450 (±100) m. Samples
from Site 803 yield an average saturation pressure of
290 bars (2900 ± 90 m).
Figure 7: H2O
versus CO2 for Ontong Java Plateau basaltic
glasses. Symbols correspond to Ocean Drilling
Program (ODP) site numbers. Vertical lines represent
degassing paths for basaltic melts with initial CO2
contents of 200 ppm (solid line) and 2000 ppm (dashed
line). Also shown are vapor saturation curves
for basaltic melts at pressures of 10-35 MPa.
All calculations were made using VolatileCalc 1.1 (Newman
& Lowenstern, 2002).
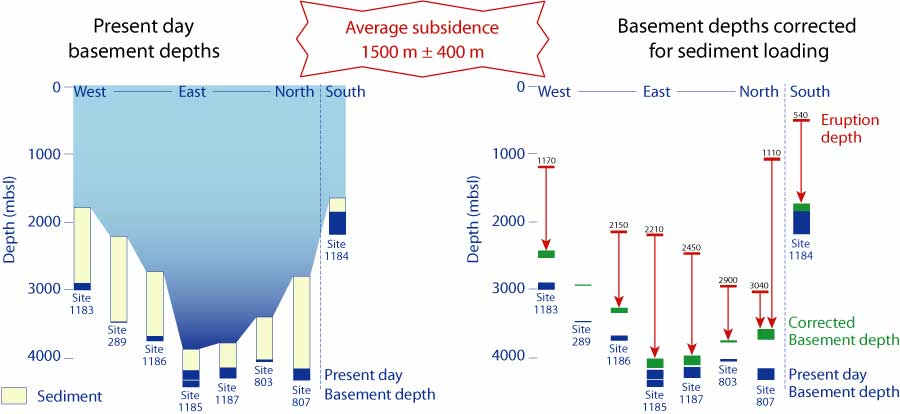
Figure 8: Eruption
depth estimates (in mbsl) for Ocean Drilling Program
(ODP) sites on Ontong Java Plateau. For all sites, present-day
depth of top of igneous basement has been corrected
for sediment loading. Corrected basement depth
(Dc) is obtained from the equation of Crough
(1983): Dc = dw + ts(rs–
rm)/( rw– rm),
where dw is water depth (in m), ts
is sediment thickness (in m), rs is average
sediment density (1.9 g/cm3), rm
is upper-mantle density (3.3 g/cm3), and
rw is seawater density (1.03 g/cm3).
The estimated eruption
depths for all sites should be viewed with caution for
several reasons (Figure 9). Submarine basaltic pillow
rims, particularly MORB samples, are commonly supersaturated
with CO2 (Dixon & Stolper, 1995),
so measured CO2 contents in pillow rims could
potentially overestimate true eruption depths. However,
submarine OJP lava flows are likely to have much larger
volumes and longer flow distances than MORB flows. Geochemical
data suggest that some OJP flows may have traveled 100s
of km (P.J. Michael, written comm.). This would
allow time for dissolved CO2 to reach equilibrium
values at the appropriate seafloor depth before final
quenching. In fact, such long downslope flow distances
could have caused lavas to be vapor saturated near their
eruption (vent) depth, which would be shallower than
the final depth of emplacement (Michael,
1999). Thus we argue that our “eruption”
depths calculated from CO2 data are minimum
values because true emplacement depths could have been
deeper. This line of reasoning provides a plausible
explanation for the large differences in CO2
contents and inferred eruption depths of glasses from
Site 807 Unit A and Units C-G (Table 1). The low
CO2 contents of Unit A glasses suggest that
this may have been part of a very long lava flow that
had an original vent in much shallower water.
In contrast, Units C-G represent multiple flows, all
of which have much higher CO2, and their
CO2 contents probably more closely represent
their original emplacement depth (3041 ± 240
m).
Figure 9: Illustration
of the potential problems of using CO2 content
to infer paleo-eruption depth.
Uplift
and subsidence of the OJP
Mesozoic marine magnetic
anomalies in the Nauru Basin (adjacent to OJP) suggest
that the OJP formed within ~130 to ~155 Ma oceanic crust.
The depth of 10 to 35 Ma oceanic crust lies between
3600 and 4700 m according to global age-depth curves
(Ingle
& Coffin,
2004). Using the high Plateau (Site 1183) eruption
depth of 1170 m and the Eastern Salient (Site 1184)
eruption depth of 540 m we calculate that the maximum
uplift was 2400-3500 m for the high Plateau and 3100-4200
m for the Eastern Salient.
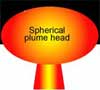
Dynamic Uplift
The arrival of a hot
and buoyant plume at the base of the lithosphere, combined
with crustal thickening due to eruption and intrusion
of a large volume of basaltic magma, should produce
substantial surface uplift (Olson & Nam,
1986). Dynamic uplift is the thermal doming produced
by viscous normal stresses imposed on the lithosphere
by the rising of a plume head and has been estimated
through experimental and theoretical studies (e.g.
Farnetani
& Richards,
1994; Hill, 1991; Griffith
et al.,
1989; Olson & Nam, 1986). The
results show that at first, before the diapir reaches
the base of the lithosphere, the surface topography
is determined by the diameter, density anomaly and depth
of the diapir (plume head). When the top of the
diapir reaches approximately one diapir radius from
the surface, an asymmetric surface swell appears increasing
in height and decreasing in width (Figure 10A).
When the upper edge of the diapir reaches 0.2 diapir
diameters below the crust surface, the height of the
surface swell attains a maximum, with a minimum width
(Figure 10B). From this point on, the swell will
subside and increase in width as the diapir spreads
laterally beneath the surface. To estimate OJP’s
uplift we need to assume a certain plume head volume,
which can be estimated from the erupted volume of the
plateau and the degree of partial melting needed to
produce it. Here, a plateau volume of 4.5 x 10⁷
km3, crustal and mantle densities of 2.9
and 3.3 g/cm3, respectively, a plume temperature
of ~1550°C, and 30% partial melting (Fitton
& Godard, 2004) are used. With these
parameters, dynamic uplift models applied to the OJP
predict an uplift of ~1000 to ~3000 m above the surrounding
seafloor depending on the shape and diameter of the
plume head (Neal
et al.,
1997; Farnetani
& Richards,
1994; Hill, 1991; Griffith
et al.,
1989; Olson & Nam, 1986).
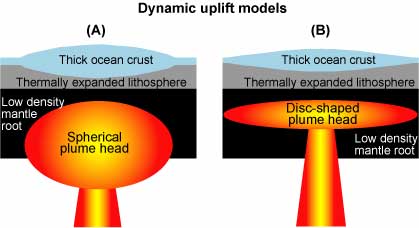
Figure 10: Illustration
of theoretical and laboratory dynamic models.
All models reach similar conclusions: Maximum dynamic
uplift for a high temperature (~1500°C) plume and
25-30% partial melting is 1000 to 3000 m.
Isostatic Uplift
Models that explain hotspot
uplift by isostatic compensation of thermally expanded
mantle rather than the dynamic effects of a rising plume
yield similar results (Ito
& Clift,
1998). The isostatic effect of crustal thickening
has also been modeled, suggesting an additional isostatic
uplift of 2 to 4 km above the adjacent seafloor (Neal
et al.,
1997). Gladczenko
et al.
(1997) calculated the average OJP crustal density
to be 2.86 g/cm3 on the basis of combined
seismic velocity analyses and gravity modeling. However,
given uncertainties in velocities and the non-unique
nature of gravity modeling, it is appropriate to calculate
isostatic uplift for a range of densities (2.8 to 3.0
g/cm3). Below sea level, water-corrected
isostasy was calculated using
 (1) (1)
where Δh is amount
of uplift above seafloor, hOJP is Ontong
Java Plateau crustal thickness, hOC is thickness
of normal oceanic crust (7 km), ρw is
water density (1.03 g/cm3), ρm
is mantle density (3.3 g/cm3), and ρOJP
is Ontong Java Plateau crustal density (2.8 to 3.0 g/cm3).
For calculations above sea level, water- and air-corrected
isostasy was calculated using
 (2) (2)
where hw is
water depth for normal 10-35 Ma oceanic crust (4.1 km).
Using the high plateau (Site 1183) crustal thickness
of ~30 km (Gladczenko
et al.,
1997), we estimate isostatic uplift ranging from
2400 m (ρOJP = 3.0 g/cm3)
to 4700 m (ρOJP = 2.8 g/cm3)
above the surrounding seafloor due to the effects of
crustal thickening (Figure 11).
Adding the initial dynamic
uplift (2000 ± 1000 m), and taking into consideration
how this changes the seafloor water depth (which in
turn influences the isostatic effect of crustal thickening),
OJP maximum total uplift would range from 4300 to 6100
(±1000) m above the surrounding seafloor (Figure
11). These estimates are larger than the estimated
maximum uplift (2500 to 3600 m) based on H2O
and CO2 data for the basaltic glasses from
Site 1183, though there is a slight overlap when the
uncertainties in dynamic uplift are considered.

Figure 11: Comparison
of predicted vs. observed uplift of Ontong Java Plateau
(OJP). Diagram A shows estimated isostatic uplift
due to crustal thickening. Diagram B shows both
isostatic and an average of 2000 m of dynamic uplift
(dashed lines) based on plateau-specific models (Neal
et al., 1997; Ito
& Clift, 1998). Diagonally ruled area
shows maximum plateau uplift inferred from paleo-eruption
depths based on CO2 data. Click here
or on figure for enlargement.
Subsidence
of the OJP
The cooling of the oceanic
lithosphere causes the density of lithospheric rocks
to increase. Older lithosphere is more dense and
cold than younger lithosphere and this causes the lithosphere
to subside as it ages (Figure 12A). Therefore,
after their emplacement, oceanic plateaus subside as
a result of cooling and contraction of the lithosphere
(Figure 12B; Detrick & Crough, 1978; Coffin,
1992). Arrival of a hot mantle plume affects this
subsidence by creating the initial dynamic uplift discussed
previously, therefore reducing the subsidence for a
certain amount of time (Figure 12C). Subsidence
curves for normal oceanic lithosphere and hotspot-affected
lithosphere suggest that the 122 Ma OJP should have
subsided ~2700 to 4100 m since its formation (Figure
13). After correcting the present-day depth to the top
of the igneous basement for sediment loading, we calculate
the total subsidence of OJP by subtracting the corrected
present-day basement depth from the original eruption
depth estimated from basaltic glass H2O and
CO2 data. The subsidence estimates
vary from 900 m (Site 803) to 1900 m (Sites 1184 and
1185) with an average of 1500 ± 400 m over much
of the plateau (Figure 14, Table 1). We have excluded
Site 807 from our subsidence average because of the
large differences in CO2 content between
Units A and C-G glasses, but our preferred eruption
depth based on the C-G glasses as described above suggests
600 ± 250 m of subsidence at this site.
Our estimated average subsidence for the OJP is lower
than previous estimates based on microfossils (Figure
1-16; Ito
& Clift,
1998) and CO2 in glasses from Site 807
Unit A (Michael,
1999).
 |
Figure
12: A) Illustration of the principle of isostasy,
which requires the oceanic crust to subside with
age to offset the thickening and cooling of the
lithosphere. B) Variations of subsidence
with time for normal oceanic lithosphere (Parsons
& Sclater, 1977; Stein & Stein, 1992).
C) Variations of subsidence with time for a hot-spot-affected
oceanic lithosphere (Ito
& Clift, 1998). |
Figure 13: Subsidence
estimates versus age for ODP sites on Ontong Java Plateau.
Subsidence estimates based on microfossils are from
Ingle
& Coffin (2004). Subsidence estimates for other
large igneous provinces (Detrick et al., 1977; Coffin,
1992) are minimum values and assume that these features
originally formed at sea level; true subsidence for
these could be 1000-2000 m greater than the values plotted.
Subsidence of hotspot-affected lithosphere (Ito
& Clift, 1998) is calculated for plume excess
temperatures (ΔT) ranging from 200°C (minimum
subsidence) to 350°C (maximum subsidence). Symbols
correspond to Ocean Drilling Program (ODP) site numbers.
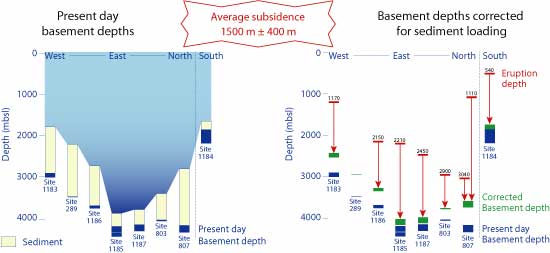
Figure 14: Illustration
of the calculation of subsidence. Using the pressure-dependent
solubilities of H2O and CO2, our
data suggest original eruption depths (at 122 Ma) varying
from ~1100 m below sea level (mbsl) on the central part
of the plateau to 2200-3000 mbsl on the eastern edge.
The glass shards from Site 1184 suggest a quenching
depth of 500 mbsl. Click here
or on figure for enlargement.
Possible
explanations for small initial uplift and subsidence
1. Dense garnet granulite in lower OJP crust
One possible explanation
is that uplift was tempered by the presence of dense
garnet granulite and possibly eclogite in the lower
OJP crust that formed from cumulates and intruded and
underplated gabbros (Neal
et al.,
1997).
|
In
Favour
Direct evidence
for garnet granulite in the lower crust comes
from xenoliths in 34 Ma alnöites on the island
of Malaita (Neal
et al.,
1997). |
Against
Seismic velocities,
gravity data, phase equilibria, and crustal thickness
estimates based on geophysical data do not support
the widespread presence of eclogite (Gladczenko
et al.,
1997; Richardson
et al.,
2000). |
These data do not eliminate
the possibility of high-density hidden cumulates in
the lower crust, but they indicate that the contribution
of such rocks to the average crustal density of OJP
is significantly less than Neal
et al. (1997)
estimated. The upper limit that we used for average
OJP crustal density (3.0 g/cm3) in our uplift
modeling (Figure 14) allows for the presence of significant
dense garnet granulite in the lower crust. Using
a density of 2.9 g/cm3 for the first 10 km
of the column and 3.0 g/cm3 for the remaining
23 km, and adding as much as 2 km of eclogite (density
of 3.6 g/cm3) at the base of the column,
the calculated initial isostatic uplift is 3 km, which
is equivalent to the isostatic uplift of the entire
column at a density of 3.0 g/cm3. Adding
the dynamic uplift of 1-2 km, our model still predicts
more initial uplift than is observed (Figure 11).
2. Underlying mantle
cause?
If crustal characteristics
of the OJP are not responsible for the anomalous uplift
and subsidence behavior, then the cause may be in the
underlying mantle. The production of an OJP-scale
volume of basaltic crust would produce an enormous melt-depleted
residuum in the upper mantle consisting of refractory
harzburgite with relatively Fe-poor olivine (Neal
et al.,
1997; Fitton & Godard, 2004) which
would be buoyant relative to fertile mantle (Robinson,
1988).
|
In
Favour
Seismic tomography
shows the presence of a rheologically strong and
seismically slow upper-mantle “root”
extending to ~300 km beneath the OJP, and the
seismic characteristics of this root suggest it
is chemical or mineralogical rather than thermal
in origin (Richardson
et al.,
2000; Klosko
et al.,
2001; Gomer & Okal, 2003). |
Against
The volume of the
root is much larger than can be explained by the
volume of mantle remaining from melt extraction
needed to form OJP basalts (Neal
et al.,
1997). Given the enigmatic nature of the low-velocity
root beneath the OJP, its role in causing the
anomalous uplift and subsidence behavior of the
plateau is unclear. |
3. Other mantle processes
Other mantle processes
that might affect subsidence include slow buoyancy flattening
of a plume (e.g., Phipps Morgan et al., 1995)
and slow cooling of the lithosphere resulting from the
thickness of the plateau, but why these would affect
the OJP but not other oceanic LIPs is unclear.
Another possibility is that large-scale magmatic underplating
of basaltic magma for ~30 Ma after formation of the
plateau provided a continued heat source, and thus reduced
subsidence (Ito
& Clift,
1998). While there is evidence of some younger volcanic
events to support this, the lack of voluminous volcanism
post-122 Ma seems inconsistent with this hypothesis.
4. Large bolide impact
As an alternative to
the mantle plume hypothesis, the OJP may have formed
as the result of a large bolide impact (Glikson,
1999) [Ed: see also OJ
Impact page]. It has been proposed that this could
explain the anomalous uplift and subsidence of the OJP
because the impact hypothesis does not require a mantle
temperature anomaly to generate large degrees of melting
(Ingle
& Coffin,
2004). The model simulates a ~20 km diameter bolide
of chondritic composition impacting a preexisting lithosphere
of ~50 km thickness at a velocity ~20 km/s (see Ingle
& Coffin,
2004, Figure 4). Vertical impact and instantaneous
vaporization of the ~4 km deep water column are assumed.
The penetration depth would be about 60 km with an initial
crater diameter of ~ 200 km (Ingle
& Coffin, 2004). Massive decompression
melting will take place in the upper mantle, to a minimum
depth of 300 km, assuming 100% partial melting resulting
from the removal of the lithospheric overburden. This
model also explains the low shear-wave velocities observed
by Richardson
et al.
(2000) by catastrophic decrease in pressure of the
solid asthenospheric mantle, moving laterally inward
and upward from below to replace the extracted mantle
during its emplacement beneath the OJP.
However, Tejada et
al. (2004) have argued that the impact hypothesis
is not consistent with geochemical and other geophysical
data for the OJP, or with the Early Cretaceous paleoenvironmental
record (see counter arguments in Ingle
& Coffin,
2004). Furthermore, it remains controversial
whether the thermal effects of a bolide impact would
indeed create surface uplift and subsidence comparable
to that of a hot mantle plume. Korenaga
(2005) argues that excavation-induced melting is
essentially the same as melting of hotter-than-normal
mantle and that the instantaneous depressurization by
the formation of the crater is equivalent to increasing
the potential temperature of the underlying mantle [Ed:
see also OJ Puzzle page].
Summary
and Conclusion
Models of multiphase fractionation
show that the high MgO Site 1187 samples could be parental
to the low MgO groups.
There is no evidence for
high magmatic H2O contents that might have
increased extents of mantle melting beneath the OJP.
Instead, large extents of melting must have been caused
by a relatively high mantle temperature.
Both the initial uplift
and post-eruption subsidence of the Ontong Java Plateau
are significantly less than predictions from thermal
models of oceanic lithosphere and are less than what
is observed for other oceanic large igneous provinces.
A few hypothesis are:
-
The uplift was tempered
by the presence of dense garnet granulite and possibly
eclogite in the plateau’s lower crust that
formed from cumulates and intruded and underplated
gabbros ( Neal
et al.,
1997). However, seismic velocities, gravity
data, phase equilibria, and crustal thickness estimates
based on geophysical data suggest that the contribution
of a dense lower crust is significantly less than
Neal
et al.
(1997) estimated ( Gladczenko
et al.,
1997; Richardson
et al.,
2000).
-
Subsidence was tempered
by the production of an enormous volume of melt-depleted,
relatively buoyant residuum in the upper mantle
that a plateau-scale volume of basaltic magma would
produce ( Neal
et al.,
1997; Fitton & Godard, 2004).
However, the volume of the root is much larger than
can be explained by melt extraction needed to form
the plateau ( Neal
et al.,
1997).
-
The plateau
may have been formed by a large bolide impact (Rogers,
1982; Ingle
& Coffin,
2004), since it does not require an anomalously
high mantle temperature and it would neither buoy
the lithosphere nor lead to subsequent lithospheric
cooling and contraction. However, whether the thermal
effects of a bolide impact are different or the
same as those of a mantle plume is not very well
defined (J. Korenaga, written communication) and
the geochemical aspect of the bolide impact hypothesis
has yet to be proven (Tejada et al., 2004).
More work is clearly needed to determine whether
this, the world’s largest large igneous province,
was formed by a mantle plume, bolide impact, or some
other process. If the OJP was formed by a plume,
then there remains a major gap in our understanding
of how large plumes interact with the Earth’s
lithosphere.
References
-
Coffin, M.F., 1992,
Emplacement and subsidence of Indian oceanic plateaus
and submarine ridges, in Duncan, R.A. et al., eds.,
Synthesis of Results from Scientific Drilling
in the Indian Ocean, Geophys. Monogr. Ser.,
AGU, Washington DC, 70, 115-125.
-
Crough,
S.T., 1983. The correction for sediment loading
on the seafloor. Journal of Geophysical Research,
88: 6449-6454.
-
Detrick,
R.S. and Crough, S.T., 1978. Island subsidence,
hot spots, and lithospheric thinning. Journal
of Geophysical Research, 83:
1236-1244.
-
Detrick,
R.S., Sclater, J.G. and Thiede, J., 1977. The subsidence
of aseismic ridges. Earth and Planetary Science
Letters, 34: 195-196.
-
Dixon,
J.E. and Stolper, E.M., 1995. An experimental study
of water and carbon dioxode solubilities in Mid-Ocean
Ridge basaltic liquids. Part II: applications to
degassing. Journal of Petrology, 36:
1633-1646.
-
Dixon,
J.E., Stolper, E.M. and Holloway, J.R., 1995. An
experimental study of water and carbon dioxode solubilities
in Mid-Ocean Ridge basaltic liquids. Part I: calibration
and solubility models. Journal of Petrology,
36: 1607-1631.
-
-
Fitton, J.G., and
Godard, M., 2004, Origin and evolution of magmas
on the Ontong Java Plateau, in Fitton, J.G., Mahoney,
J.J., Wallace, P.J., and Saunders, A.D., eds., Origin
and Evolution of the Ontong Java Plateau, Geological
Society (London) Special Publication, 229,
151-178.
-
-
-
Gomer,
B.M. and Okal, E.A., 2003. Multiple-ScS
probing of the Ontong-Java Plateau. Physics
of the Earth and Planetary Interiors, 138:
317-331.
-
-
Hill,
R.I., 1991. Starting Plumes And Continental Break-Up.
Earth and Planetary Science Letters, 104:
398-416.
-
-
-
-
-
Mahoney,
J.J., Fitton, J.G., Wallace, P.J., et al., 2001,
Proceedings of the Ocean Drilling Program, Initial
Reports, 192, 75 pp.
-
Michael,
P.J., 1995. Regionally distinctive sources of depleted
MORB: evidence from trace elements and H2O.
Earth and Planetary Science Letters, 131:
301-320.
-
-
Neal,
C.R., Mahoney, J.J., Kroenke, L.W., Duncan, R.A.
and Petterson, M.G., 1997. The Ontong Java Plateau.
In: J.J. Mahoney and M.F. Coffin (Editors), Large
Igneous Provinces continental: continental, oceanic,
and planetary flood volcanism. Geophysical
Monograph. American Geophysical Union, Washington
D.C., pp. 183-216.
-
Newman,
S. and Lowenstern, J.B., 2002. VOLATILECALC: a silicate
melt-H2O-CO2 solution model
written in Visual Basic for excel. Computers
& Geosciences, 28: 597-604.
-
Olson,
P. and Nam, I.S., 1986. Formation of seafloor swells
by mantle plumes. Journal of Geophysical Research,
91: 7181-7191.
-
Parsons,
B. and Sclater, J.G., 1977. An analysis of the variation
of ocean floor bathymetry and heat flow with age.
Journal of Geophysical Research, 82:
803-827.
-
Phipps-Morgan,
J.P., Morgan, W.J., Zhang, Y.S. and Smith, W.H.F.,
1995. Observational Hints For A Plume-Fed, Suboceanic
Asthenosphere And Its Role In Mantle Convection.
Journal of Geophysical Research-Solid Earth,
100: 12753-12767.
-
-
Roberge,
J., Wallace, P. J., White, R. V., and Coffin, M.
F., 2005, Anomalous uplift and subsidence of the
Ontong Java Plateau inferred from CO2
contents of submarine basaltic glasses. Geology,
33, 501-504.
-
Roberge,
J., White, R. V. and Wallace, P. J. , Volatiles
in submarine basaltic glasses from the Ontong Java
Plateau (ODP Leg 192): implications for magmatic
processes and source region compositions, in: Origin
and Evolution of the Ontong Java Plateau, Fitton
J.G., Mahoney J.J., Wallace P.J. and Saunders
A.D., Eds., Geological Society (London) Special
Publication, 229, 239-257, 2004.
-
Robinson,
E.M., 1988. The Topographic and Gravitational Expression
of Density Anomalies Due to Melt Extraction in the
Uppermost Oceanic Mantle. Earth and Planetary
Science Letters, 90: 221-228.
-
Stein,
C.A. and Stein, S., 1992. A model for the global
variation in oceanic depth and heat flow with lithospheric
age. Nature, 359: 123-129.
-
Tejada, M.L.G.,
Mahoney, J.J., Castillo, P.R., Ingle, S.P., Sheth,
H.C., and Weis, D., 2004, Pin-pricking the elephant:
evidence on the origin of the Ontong Java Plateau
from Pb-Sr-Hf-Nd isotopic characteristics of ODP
Leg 192 basalts, in Fitton, J.G., Mahoney, J.J.,
Wallace, P.J., and Saunders, A.D., eds., Origin
and Evolution of the Ontong Java Plateau, Geological
Society (London) Special Publication, 229,
133-150.
-
Thordarson, T., 2004. Accretionary-lapilli-bearing
pyroclastic rocks at ODP Leg 192 Site 1184: a record
of subaerial phreatomagmatic eruptions on the Ontong
Java Plateau. In: J.G. Fitton, J.J. Mahoney, P.J.
Wallace and A.D. Saunders (Editors), Origin
and Evolution of the Ontong Java Plateau. Geological
Society (London) Special Publication, pp. 239-257.
last updated 31st December, 2006
|