 |
Testing
the Existence of a Mantle Diapir Below the
Southern Scandes |
Christophe
Pascal &
Odleiv Olesen
NGU, Geological
Survey of Norway, N-7491 Trondheim, Norway; Christophe.pascal@ngu.no ; Odleiv.Olesen@NGU.NO
This webpage is a synopsis of the paper:
Pascal, C. & O.
Olesen, Are the Norwegian mountains compensated by
a mantle thermal anomaly at depth?, Tectonophysics, 475,
160-168, 2009.
Click here for
Discussion of this webpage
Introduction
The Scandes are a long mountain range that stretches
for more than 1400 km through most of Norway and parts
of central and northern Sweden. They are traditionally
divided into two dome-like areas (the southern and
northern Scandes), which are separated by a central
area with less pronounced topography (Figure 1a).
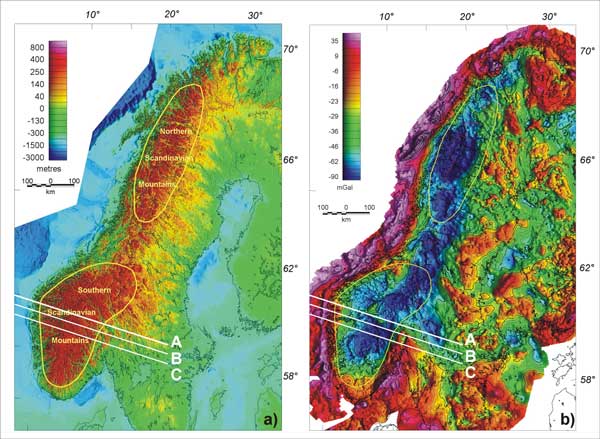
Figure 1: a) topography (Dehls
et al., 2000) and b) Bouguer gravity anomalies of
Fennoscandia (Skilbrei et al., 2000; Korhonen et
al., 2002). A, B, C represent the three lines used
in the gravity modelling. Note the spatial correlation
between the most pronounced gravity lows and the
location of the Scandes. Click
here or
on figure for enlargement.
The origin of the Scandes mountain
chain far away from any plate boundary remains a matter
of debate in the geoscientific community and various
models have been advanced. A non-exhaustive list of
invoked causes includes:
- Opening of the NE Atlantic (Torske, 1972);
- Isostatic response to glacial erosion (Doré,
1992; Riis & Fjeldskaar, 1992);
- Pre-subduction instability (Sales, 1992);
- intraplate stresses (Cloetingh et al.,
1990);
- Mantle convection (Bannister et al., 1991);
- Climate deterioration and sea-level changes (Eyles,
1996);
- Small-scale convection (Stuevold & Eldholm,
1996);
- Rift-shoulder uplift (Doré, 1992, Redfield
et al., 2005);
- Asthenospheric diapirsm (Rohrman & van
der Beek, 1996; Rohrman et al., 2002);
- Migrating phase boundaries (Riis & Fjeldskaar,
1992);
- Serpentinisation (Skelton & Jakobsson,
2007), and more recently;
- Modification of the Caledonian topography (Nielsen
et al., 2009).
The most accepted model, and probably
the most satisfactory one in terms of accounting for
most of the observations, is the asthenospheric diapir
model advanced by Rohrman & van
der Beek (1996).
The aim of the present contribution
is to test the asthenospheric diapir model by means
of integrated modelling of high-resolution gravity
data with modern heat flow data. We first summarise
the theoretical background and the implications of
the asthenospheric diapir model. We then model the
long-wavelength field (i.e., associated with
compensating masses below the mountains) of
the Bouguer gravity anomalies in southern Norway, in
order to constrain the depth of the assumed asthenospheric
body and its density deficit or, conversely, its temperature
excess. The predictions are then tested against recently
acquired heat flow data.
The asthenospheric diapir model
The asthenospheric diapir model (Figure
2) involves impingement of anomalously hot asthenosphere
at the base of cold cratonic lithosphere (Rohrman & van
der Beek, 1996; Rohrman et al., 2002).
According to the model, the hot asthenosphere originates
in the Iceland hotspot emplaced in the Norwegian-Greenland
Sea at ~30 Ma (Lawver & Müller, 1994).
Hot material travels through a thin asthenosphere layer
before meeting cold cratonic lithosphere. The contrast
in temperature (i.e., viscosity) between the
two produces a Rayleigh-Taylor instability. This process
is similar to the one that leads to the formation of
thunderclouds. Finally the rise of the asthenospheric
diapir creates isostatic uplift of the surface. Rohrman & van
der Beek (1996) invoke two cases. In the first
case, the diapir has reached relatively shallow levels
in the lithosphere and subsequent decompression melting
results in volcanism at the surface (e.g.,
at Spitsbergen). In the second case, which would
represent the Scandes, the asthenospheric
diapir is still located at great depth at the present
day and therefore no melting has occurred yet but topography
is compensated by the hot diapir at depth.
Figure 2: The asthenospheric diapir model: interaction
between anomalously hot asthenosphere and cold cratonic
lithosphere produces a Rayleigh-Taylor instability,
penetration of hot asthenosphere into mantle lithosphere,
and subsequent uplift of the Earth's surface (redrawn
from Rohrmann and van der Beek, 1996).
The asthenospheric diapir model is probably the most
elegant one while reconciling different pieces of the
puzzle. It accounts for both the amount (i.e., 1-2
km) and the apparent timing (i.e., mostly
Neogene) of uplift and integrates various geological
and geophysical observations into a coherent scheme
(Rohrman et al., 2002). The main conclusions
derived by Rohrman & van der Beek (1996)
are that the top of the diapir is located at ~100 km
depth, its vertical extent is ~100 km, its radius 100-150
km and the temperature contrast between the hot asthenosphere
and the cold lithosphere is ~400°C (Figure 2).
Bearing in mind these numerical values, we evaluate
the asthenospheric diapir model.
Integrated gravity-thermal modelling of the
southern Scandes
Testing the gravity response of the asthenospheric
diapir
We focused our study on the southern
Scandes and used the high-resolution (i.e., one
measurement every ~3 km) gravity database at NGU (Skilbrei
et al., 2000). In order to model Bouguer anomalies
we selected data points along three NW-SE profiles
across the middle of the southern Scandes (Figure 1).
The aim of our modelling was to find the nature and
depth of the sources that reproduce a gravity signal
consistent with the one suggested by the gravity
data.
First, we placed at 100 km depth a
100-km-wide body and tested different density contrast
values with respect to the neighbouring rocks (Figure
3). Our analysis shows that a density reduction between
the lithosphere and the hot asthenosphere of -50 kg/m3,
which would correspond to a reasonable value of ~3250
kg/m3 for
the density of the asthenosphere, produces a very smooth
gravity signal unlikely to be detected. Increasing
the density contrast to -100 kg/m3 increases
the amplitude of the signal and its gradient but is
far from satisfying the shape of the gravity low as
it is suggested by the data points. Apparently a density
contrast higher than this latter value and close or
equal to -200 kg/m3 would meet our requirements
(Figure 3). However, such a density contrast value
would result in unrealistically temperatures much higher
than 1750°C
for the assumed diapir. This latter temperature value
already exceeds by ~150°C maximum temperatures
estimated for thermal anomalies in the upper mantle
(e.g., Goes et al., 2004). In brief, this
first modelling exercise demonstrates that, in order
to match the observed gravity low, the asthenospheric
diapir cannot be located at great depth below the
surface.
Figure 3: Gravity modelling assuming an asthenospheric
diapir at 100 km depth and as a function of density
contrast, Δρ, between the diapir and surrounding lithosphere
(or alternatively diapir temperature, Td, assuming
average lithosphere temperatures of ~1000°C).
Dots represent gravity data, extracted along profiles
A, B and C (Figure 1), and solid lines modelled gravity
responses (see details in Pascal & Olesen 2009).
Note that it is impossible to reproduce the key characteristics
of the observed gravity signal unless diapir temperatures
reach unreasonably high values.
Alternatively, the asthenospheric diapir could be
at shallower depths than anticipated. We calculated
the gravity effect placing the diapir at different
depths. A reasonable fit between observed and modelled
gravity is obtained only if we assume that the diapir
has reached relatively shallow depths (i.e., ~40
km,), close to the Moho (Stratford et al., 2009).
It appears that a density contrast of between -50 kg/m3 and -100 kg/m3 would reproduce reasonably well the
observed gravity low, implying diapir temperatures
higher than 1400°C and lower than or equal to
1750°C (Pascal & Olesen, 2009).
Testing the heat flow response of the asthenospheric
diapir
We explored the consequences for
surface heat flow assuming that the top of the diapir
is located at 40 km depth and its temperature is between
1400°C
and 1750°C. In addition, we followed Rohrman
et al. (1995, 2002) and assumed that uplift of
the Scandes (i.e., emplacement of the diapir)
started at 30 Ma. We used the most recent heat flow
database for southern Norway, suggesting typical heat
flow values of 58 ± 12 mW/m2 (Slagstad
et al., 2009), and assumed typical pre-uplift
heat flows of ~40 mW/m2 (i.e., lowermost
continental heat flow; Nyblade & Pollack, 1993),
the difference between measured present-day heat flow
and this latter value (i.e., ~20 mW/m2)
being sourced from the asthenospheric diapir.
First-order
analytical models of surface heat flow evolution, after
emplacement of the asthenospheric diapir, suggested
that present heat flow values should be at least 10
mW/m2 higher
than observed (Pascal & Olesen, 2009).
In order to confirm these preliminary findings we conducted
more advanced thermal modelling by means of finite-element
techniques (Figure 4). We modelled the 2D transient
response of the lithosphere after emplacement of a
hot diapir. We assumed a sudden rise in temperature
at the location of the diapir at t = 0 and let the
system evolve. First, we set a temperature of Td
= 1500°C for the diapir and maintained it constant
through time. This latter value represents a mantle
thermal anomaly with average temperatures (e.g.,
Goes et al., 2004) but already results in an increase
in surface heat flow of more than 55 mW/m2,
20 Ma after its application (Figure 4b). We thus decreased
the temperature of the diapir down to its lowermost
permissible value of Td = 1300°C (i.e., corresponding
to "normal" asthenosphere). The increase
in surface heat flow after 20 Ma still reached more
than 40 mW/m2 (Figure 4b) or,
conversely, the model suggested that present-day surface
heat flow in southern Norway should be equal to 80
mW/m2, exceeding by 20 mW/m2 the
measured average value. The obvious conclusion from
these modelling tests was that the emplacement of a
mantle diapir at 40 km depth at 30 Ma is unlikely,
because it would have produced much higher present-day
surface heat flow values than actually measured.
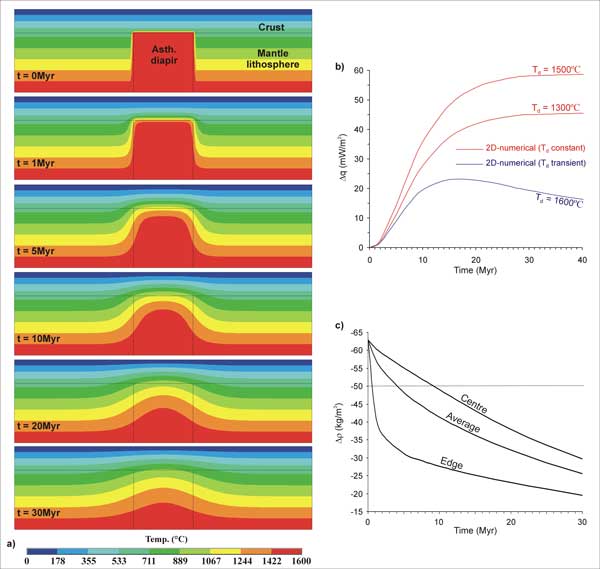
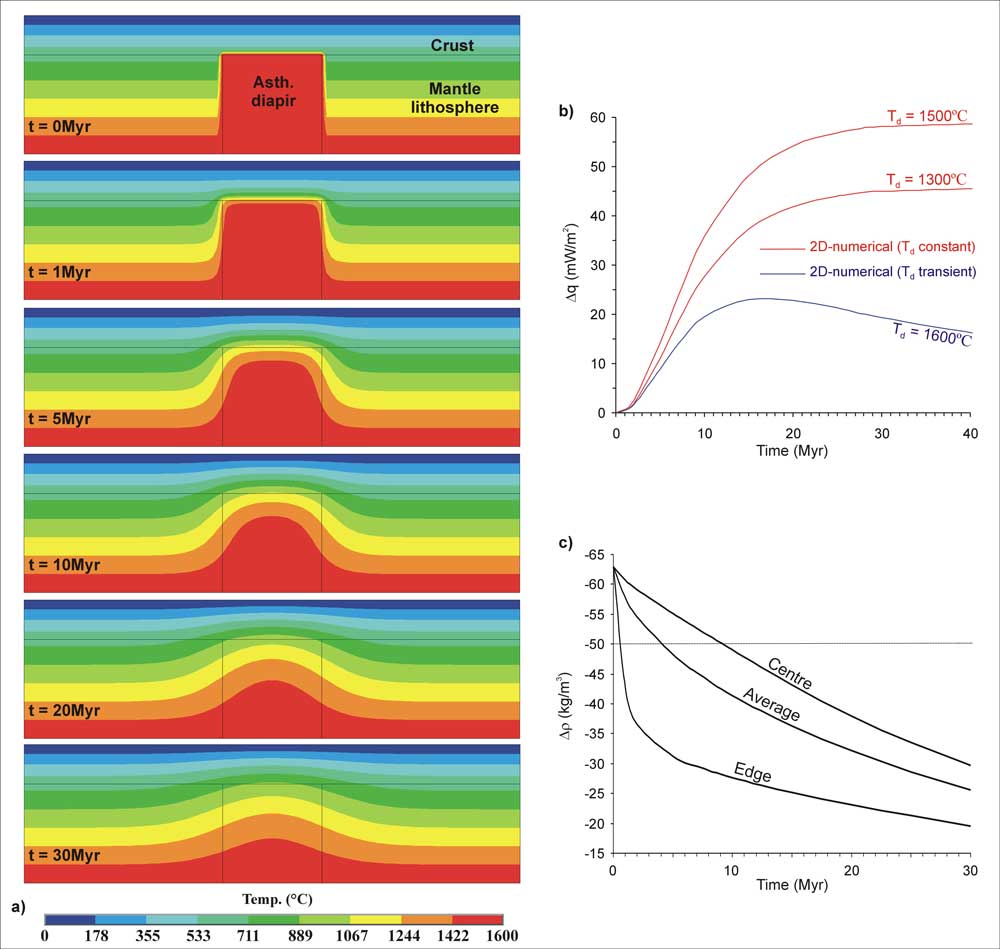
Figure 4: a) 2D finite-element
model: thermal evolution after impingement of
an asthenospheric diapir at 40 km depth at t = 0.
The temperature of the diapir is initially Td =
1600°C
and it is allowed to evolve. Note the fast decay
in diapir temperatures. b) Evolution of surface heat
flow vs. time after emplacement of the asthenospheric
diapir at 40 km depth. Red curves represent 2D numerical
solutions where Td is diapir temperature
and is kept constant. The blue curve corresponds to
the transient numerical solution depicted in a). c)
Evolution of the density contrast between
the diapir and the surrounding lithosphere for the
transient numerical solution depicted in a). The results
are given for the centre and the lateral edges of the
diapir. The evolution of the average density contrast
is also shown. Note that previous gravity modelling
shows that the gravity signal cannot be reproduced
for Δρ > –50 kg/m3.
Click
here or
on figure for enlargement.
From a physical point of view it
is doubtful that an intruded diapir could maintain
a constant temperature with time. In order to be complete,
our last numerical modelling test addressed the effect
of cooling of the asthenospheric diapir on the evolution
of surface heat flow and mantle densities. We used
similar modelling parameters as previously but allowed
diapir temperatures to evolve following 2D heat diffusion.
We report here only one simulation where Td was
set to its maximum allowed value of 1600°C (i.e., mantle
thermal anomaly of + 300°C, Goes et al., 2004)
at t = 0. The cooling of the diapir, following its
assumed fast intrusion into the lithosphere, is rapid
in particular at shallow depths (Figure 4a). Compared
to previous modelling results the surface heat flow
signal is drastically reduced and decays after having
reached ~23 mW/m2 at t ~15 Ma (Figure 4b).
Therefore, assuming that no magma has reached relatively
shallow levels in the crust, the heat flow anomaly
would not be detectable despite the high temperature
assumed for the mantle diapir.
Based solely on thermal considerations
the asthenospheric diapir hypothesis could apparently
pass this last modelling test. However, as temperature
declines within the diapir, density increases.
Using the modelled temperatures we computed the evolution
of the density contrast between asthenospheric rocks
within the diapir and the surrounding mantle lithosphere
(Figure 4c; see details in Pascal & Olesen, 2009).
Following the cooling of the diapir its density increased
quickly, in particular at its edges.
Figure 4c shows that average values of Δρ (the density
contrast between the lithosphere and the diapir) are –50
kg/m3 shortly after ~4 Ma and reach –25
kg/m3 at t = 30 Ma, whereas our gravity
modelling demonstrates that Δρ values between –100
and -50 kg/m3 are
needed in order to explain the observed gravity low.
The evident conclusion from this modelling exercise
is that the southern Scandes cannot be isostatically
balanced by an asthenospheric diapir at depth.
Discussion and conclusions
Our integrated gravity/thermal approach
demonstrates that the topography of the southern Scandes
is not compensated by a mantle thermal anomaly at depth.
A simple analysis of the Bouguer gravity field shows
that the mass deficit needs to be located close to
the Moho as already demonstrated by Olesen et al. (2002).
New heat flow data show that whatever the nature of
this mass deficit it cannot, in any case, be related
to a thermal anomaly. This statement would find even
more support if we had considered thermal advection
in our computations, which is a far more efficient,
and perhaps more natural, way to transport excess
heat to the surface.
Our analysis does not demonstrate
the cause of Scandes uplift. Indeed the only criticism
that can be addressed to the asthenospheric diapir
model seems to be the assumption that the Bouguer
gravity low is caused by a hot diapir or,
conversely, that the topography is compensated
by a mantle thermal anomaly. The other arguments
in favour of the model of Rohrman & van
der Beek (1996) (to our mind a brilliant one)
appear to remain valid. In particular, the existence
of a low-velocity anomaly at 75-150 km depth below
southern Norway has been confirmed by a recent tomographic
study (Weidle & Maupin, 2008). This study
resolved the mantle structure of the NE Atlantic with
better resolution than previous seismic studies (Husebye
et al., 1986; Bannister et
al., 1991; Rohrman et al.,
2002) and imaged a continuous low-velocity anomaly
stretching from Iceland to southern Norway as proposed
in the asthenospheric diapir model. All this calls
for a modification, but not a firm rejection, of the
diapir model.
References
-
Bannister, S.C., Ruud, B.O., Husebye, E.S., 1991.
Tomographic estimates of sub-Moho seismic velocities
in Fennoscandia and structural implications. Tectonophysics, 189,
37-53.
-
Cloetingh, S.A.P.L., Gradstein, F.M., Kooi, H., Grant,
A.C., Kaminski, M., 1990. Plate reorganization; a cause
of rapid late Neogene subsidence and sedimentation
around the North Atlantic. Journal Geological Society
of London, 147, 495-506.
-
Dehls, J.F., Olesen, O., Bungum, H., Hicks, E., Lindholm,
C.D., Riis, F., 2000. Neotectonic map, Norway and
adjacent areas 1:3 mill.Norges geologiske
undersøkelse,
Trondheim, Norway.
-
Doré, A.G., 1992. The
base Tertiary surface of southern Norway and the
northern North Sea. Norsk
Geologisk Tidsskrift, 72, 259-265.
-
Eyles, N., 1996. Passive margin
uplift around the North Atlantic and its role in
Northern Hemisphere late Cenozoic glaciation. Geology, 24,
103-106.
-
Goes, S., Cammarano, F., Hansen, U., 2004. Synthetic
seismic signature of thermal mantle plumes. Earth & Planetary
Science Letters, 218, 403-419.
-
Husebye, E.S., Hovland, J.,
Christofferson, A., Åström,
K., Slunga, R., Lund, C.E., 1986. Tomographic mapping
of the lithosphere and asthenosphere beneath Southern
Scandinavia and adjacent areas. Tectonophysics, 28,
229-250.
-
Korhonen, J.,V., Aaro, S., All,
T., Elo, S., Haller, L.Å., Kääriäinen, J., Kulinich,
A., Skilbrei, J.R., Solheim, D., Säävuori,
H., Vaher, R., Zhdanova, L., Koistinen, T., 2002. Bouguer
anomaly map of the Fennoscandian shield 1: 2,000,000.
Geological Surveys of Finland, Norway and Sweden
and Ministry of Natural Resources of Russian Federation.
-
Lawver, L. A., Müller,
R. D., 1994. Iceland hotspot track. Geology, 22,
311-314.
-
Nielsen, S.B., Gallagher, K., Leighton, C., Balling,
N., Svenningsen, L., Jacobsen, B.H., Thomsen, E., Nielsen,
O. B., Heilmann-Clausen, C., Egholm, D. L., Summerfield,
M.A., Clausen, O.R., Piotrowski, J.A., Thorsen, M.R.,
Huuse, M., Abrahamsen, N., King, C., Lykke-Andersen,
H., 2009. The evolution of western Scandinavian topography:
A review of Neogene uplift versus the ICE (isostasy-climate-erosion)
hypothesis, Journal of Geodynamics, 47,
72-95.
-
Nyblade, A.A., Pollack, H.N.,
1993. A global analysis of heat flow from Precambrian
terrains: implications for the thermal structure
of Archean and Proterozoic lithosphere. J.
Geophys. Res., 98,
12207-12218.
-
Olesen, O., Lundin, E., Nordgulen, Ø.,
Osmundsen, P.T., Skilbrei, J.R., Smethurst, M.A.,
Solli, A., Bugge, T., Fichler, C., 2002. Bridging
the gap between the onshore and offshore geology
in Nordland, northern Norway. Norwegian Journal of Geology, 82,
243–262.
-
-
Redfield, T. F., Osmundsen,
P. T., Hendriks, B. W. H., 2005. The role of
fault reactivation and growth in the uplift of
western Fennoscandia. Journal of the Geological
Society, London, 162,
1-18.
-
Riis, F., Fjeldskaar, W., 1992. On the magnitude
of the Late Tertiary and Quaternary erosion and its
significance for the uplift of Scandinavia and the
Barents Sea. Norwegian
Petroleum Society Spec. Publ., 1,
163-185.
-
Rohrman, M., van der Beek, P., 1996. Cenozoic postrift
domal uplift of North Atlantic margins; an asthenospheric
diapirism model. Geology, 24,
901-904.
-
Rohrman, M., van der Beek, P.A., Andriessen, P.A.M.,
Cloetingh, S.A.P.L., 1995. Meso-Cenozoic morphotectonic
evolution of southern Norway: Neogene domal uplift
inferred from apatite fission track thermochronology. Tectonics, 14,
704-718.
-
Rohrman, M., van der Beek, P.A.,
van der Hilst, R.D., Reemst, P., 2002. Timing and
mechanisms of North Atlantic Cenozoic Uplift: Evidence
for mantle upwelling. In: Doré,A.G., Cartwright,
J.A., Stoker, M.S., Turner, J.P., White, N. (Eds.)
Exhumation of the North Atlantic Margin: Timing,
Mechanisms and Implications for Petroleum Exploration. Geological Society of London, Special
Publications, 27-43.
-
Sales, J.K., 1992. Uplift and subsidence of northwestern
Europe: possible causes and influence on hydrocarbon
productivity. Norsk Geologisk Tidsskrift, 72,
253-258.
-
Skelton, A., Jakobsson, M., 2007. Could peridotite
hydration reactions have provided a contributory
driving force for Cenozoic uplift and accelerated
subsidence along the margins of the North Atlantic
and Labrador Sea? Norwegian Journal of Geology, 87,
21-28.
-
Skilbrei, J.R., Kihle, O., Olesen, O., Gellein,
J., Sindre, A., Solheim, D., Nyland, B., 2000. Gravity
anomaly map Norway and adjacent ocean areas, scale
1:3 Million. Geological Survey of Norway,
Trondheim.
-
Slagstad, T., Balling, N., Elvebakk,
H., Midttømme,
K., Olesen, O., Pascal, C., 2008. Heat-flow measurements
in early Mesoproterozoic to Permian geological
provinces in south and central Norway and a new
heat-flow map of Fennoscandia and the Norwegian-Greenland
Sea. Tectonophysics, 473,
341-361.
-
Stratford, W., Thybo, H., Faleide, J.I., Olesen, O.,
Tryggvason, A., 2009. New Moho map for onshore southern
Norway. Geophysical Journal International, 178,
1755-1765.
-
Stuevold, L.M., Eldholm, O., 1996. Cenozoic uplift
of Fennoscandia inferred from a study of the mid-Norwegian
margin. Global and Planetary Change, 12,
359-386.
-
Torske, T., 1972. Tertiary oblique uplift of western
Fennoscandia, crustal warping in connection with
rifting and break up of the Laurasian continent. Norges
geologiske undersøkelse, 273,
43-48.
-
Weidle, C., Maupin, V., 2008. An upper mantle S-wave
velocity model for Northern Europe from Love and
Rayleigh group velocities. Geophysical Journal International, 175,
1154-1168.
Discussion
Hermann G W Burchard, 24th November, 2009
Do the
authors prefer model #9 while dismissing that model
#2 might be a causative agent?
Model 2. Isostatic response to glacial erosion (Doré,
1992; Riis & Fjeldskaar, 1992);
Model 9. Asthenospheric diapirsm (Rohrman & van
der Beek, 1996; Rohrman et
al., 2002);
Not having read Rohrman et al, perhaps I should not
comment. However, this webpage
does not mention WHY the diapir should have started
to rise.
Back
last updated 1st
November, 2009 |