 |
Mantle Transition Zone Discontinuities
Beneath Yellowstone
Imaged Using Multiply-Reflected P-to-S Conversions
|
Stephen S. Gao & Kelly H. Liu
Department of Geological Sciences and Engineering, Missouri University of Science and Technology, Rolla, Missouri 65409, USA,
sgao@mst.edu ; liukh@mst.edu
This webpage is a summary of: Stephen S. Gao and Kelly H. Liu, 2013. Imaging mantle discontinuities using multiply-reflected P-to-S conversions. Earth and Planetary Science Letters, doi: http://dx.doi.org/10.1016/j.epsl.2013.08.025.
Introduction
Improving reliability and accuracy in measurements of the depth to the 410-km (d410) and 660-km (d660) discontinuities is essential for a better understanding of mantle dynamics, as well as for addressing fundamental questions such as the origin of mantle plumes and the fate of subducted slabs. A number of previous receiver function (RF) studies used either velocities in a standard Earth model such as IASP91, or tomography-derived velocities with large uncertainties, for moveout correction and time-to-depth conversion. Due to the intrinsic trade-off between the velocities above the discontinuities and the derived depths, the resulting apparent discontinuity depths can be significantly in error. The trade-off is particularly problematic for determining the existence of mantle plumes in the mantle transition zone (MTZ) (e.g., Shen et al., 1998; Foulger et al., 2001; Das-Sharma et al., 2010; Fee & Dueker, 2004; Cao & Levander, 2010; Schmandt et al., 2012) because while the higher-than-normal temperature associated with a mantle plume may lead to a thinned MTZ in an olivine-dominated system, the lower-than-normal velocities generally observed delay the travel-times of the P-to-S converted phases and result in an apparent thickening of the MTZ. These opposing effects on the observed thickness of the MTZ contribute to the controversies regarding the depth extent of mantle plumes.
Method
Here we present an approach to simultaneously estimate the velocity-independent depths ("true depths") of the MTZ discontinuities and the average P- and S-wave velocity anomalies in the overlying layers, by utilizing both P-to-S converted waves from the discontinuities and their multiples (Figure 1).
Figure 1: Schematic diagrams showing the ray path of the direct P wave (solid line segments), which pierces the discontinuity at point A, and that of the PdS (left plot) and PpdS (right plot). P-to-S conversion takes place at point B. Dashed line segments represent converted S-waves.
Steps in the analysis include:
- masking the strong PP arrivals prior to computing RFs (Figure 2),
- computing non-plane-wave travel-times for PdS and PpdS for accurate moveout corrections, and
- utilizing the discrepancies in the apparent discontinuity depths from PdS and PpdS to simultaneously estimate velocity anomalies and discontinuity depths that are independent of velocity anomalies (Gao & Liu, 2013).
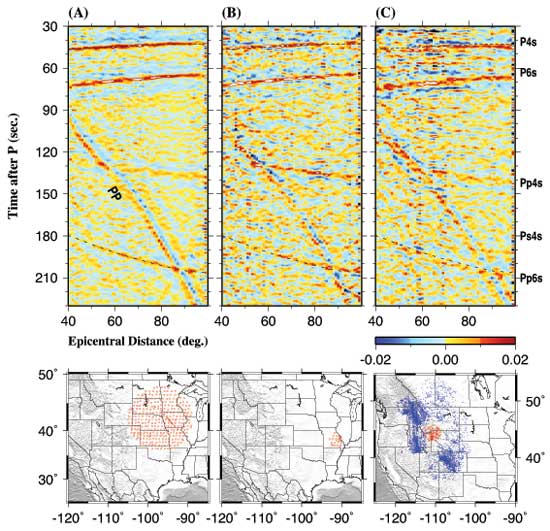
Figure 2: Top panels: Radial RFs stacked in epicentral distance bins. (A) Results using stations in a radius = 6° circle on the great plains of North America; (B) Results using stations from a radius = 1.5° circle in the eastern Missouri; (C) Results using stations from a radius = 1.5° circle centered at the Yellowstone hotspot. Bottom panels: Distribution of seismic stations (circles) used to produce the binned RFs shown in the panel above. Blue dots in the lower-right panel represent PpdS ray-piercing points at 530 km depth.
We applied the procedure to data recorded by stations in seven radius=1.5° circles along a 780-km, N-S profile centered on the Yellowstone hotspot (Figures 3 & 4).
Figure 3: Seismic stations (squares) in 7 radius=1.5° circles along the -110.67° longitudinal line centered on Yellowstone (triangle).
Figure 4: Results of stacking of moveout-corrected RFs using PpdS (red curves) and PdS (blue curves) for the 7 groups of RFs. The number of RFs included in each stack is shown at the top of the traces.
Results & conclusions
The results obtained using PdS and PpdS (Figure 5) suggest that while the proposed Yellowstone hotspot is associated with an upper-mantle low-velocity anomaly, the anticipated depression of the 410-km discontinuity and uplift of the 660-km discontinuity associated with a well-defined mantle plume beneath Yellowstone is not observed. This suggests that the source of magma may reside in the upper mantle. This conclusion is consistent with that from some previous studies (Leeman et al., 2009; Cao & Levander, 2010) but different from others (e.g., Fee & Dueker, 2004; Schmandt et al., 2012). The contrasting conclusions drawn from these numerous studies mostly result from differences in the data, techniques, and assumptions employed, and they call for additional investigations of the nature of this hotspot.
Figure 5. Mean measurements obtained from bootstrap-stacking of RFs. (A) Apparent depths for the 410-km discontinuity using the PdS (blue circles) and PpdS (red triangles) phases. The dashed line shows the resulting true depth of the 410-km discontinuity. (B) Same as (A) but for the 660-km discontinuity. (C) Same as (A) but for the thickness of the MTZ. (D) P-wave velocity anomalies above the 410-km discontinuity (circles) and 660-km discontinuity (triangles). The red-dashed line and the blue-dashed line show the average P-wave velocity anomalies above 420 km and 660 km, respectively, converted from the S-wave velocities of Obrebski et al. (2011). (E) P-wave velocity anomalies in the MTZ (circles). The dashed line shows average MTZ P-wave velocity anomalies (Obrebski et al., 2011).
References
-
Cao, A., Levander, A., 2010. High-resolution transition zone structures of the Gorda Slab beneath the western United States: Implication for deep water subduction, J. Geophys. Res. 115, B07301, doi:10.1029/2009JB006876.
-
Das-Sharma, S., Ramesh, D.S., Li, X., Yuan, X., Sreenivas, B., Kind, R., 2010. Response of mantle transition zone thickness to plume buoyancy flux, Geophys. J. Int. 180, 49-58, doi: 10.1111/j.1365-246X.2009.04403.x.
-
Fee, D., Dueker, K., 2004. Mantle transition zone topography and structure beneath the Yellowstone hotspot, Geophys. Res. Lett. 31, L18603, doi:10.1029/2004GL020636.
-
Foulger, G.R., et al., 2001. Seismic tomography shows that upwelling beneath Iceland is confined to the upper mantle, Geophys. J. Int. 146, 504-530.
-
Gao, S.S., Liu, K.H., 2013. Imaging mantle discontinuities using multiply-reflected P-to-S conversions, Earth Planet. Sci. Lett., doi: http://dx.doi.org/10.1016/j.epsl.2013.08.025.
-
Leeman, W. P., Schutt, D. L., Hughes, S. S., 2009. Thermal structure beneath the Snake River Plain: Implications for the Yellowstone hotspot, J. Volc. Geotherm. Res. 188, 57-67, doi:10.1016/j.jvolgeores.2009.01.034.
-
Obrebski, M., Allen, R. M., Pollitz, F., Hung, S.-H., 2011. Lithosphere-asthenosphere interaction beneath the western United States from the joint inversion of body-wave traveltimes and surface-wave phase velocities, Geophys. J. Int. 185, 1003-1021, doi: 10.1111/j.1365-246X.2011.04990.x.
-
Schmandt, B., Dueker, K., and Humphreys, E., 2012. Hot mantle upwelling across the 660 beneath Yellowstone, Earth Planet. Sci. Lett. 331-332, 224-236, doi: 10.1016/epsl.2012.03.025.
-
Shen, Y., Solomon, S.C., Bjarnason, I.T., Wolfe, C.J., 1998. Seismic evidence for a lower-mantle origin of the Iceland plume, Nature 395, 62-65.
last updated 28th
October, 2013 |