 |
Searching
for Mantle
Plumes Using High-Resolution Radon Transforms |
Yu
Jeffrey Gu & Yuling
An
Dept. of Physics, University
of Alberta, Edmonton, AB, Canada, T6G2G7; jgu@phys.ualberta.ca
Introduction
The
origin of melting anomalies (or “hotspots”)
has long been a focal point in the discussion of two
competing classes of convection models, the bottom-up
(“plume”) model that routinely draws comparisons
with a pot of water on a hot stove (Morgan,
1971) and the top-down (“plate”) model
that emphasizes the role of lithosphere, plate stresses
and recycling of the enriched crust (see Foulger,
2007 for a detailed review; Ed: See also Plate
Tectonic Processes page). This
debate is reinvigorated by recent reports of a
plethora of narrow low-velocity columns beneath hotspot
locations based on high-resolution, finite-frequency
tomography (Montelli et
al., 2006). While
the effect of the finite-frequency approach over
traditional ray-based techniques has been disputed
(de
Hoop & van der Hilst, 2005; Ed: See
also Banana Doughnut page),
the need to understand the existence and vertical
extent of hot mantle plumes has not.
Technical details
The
main goal of this study is to improve the resolution
of the structure of mantle seismic discontinuities using
the High-resolution Radon transform method (Sacchi
& Ulrych,
1995). This
method utilizes frequency-domain inversions to simultaneously
constrain the differential times and ray parameters
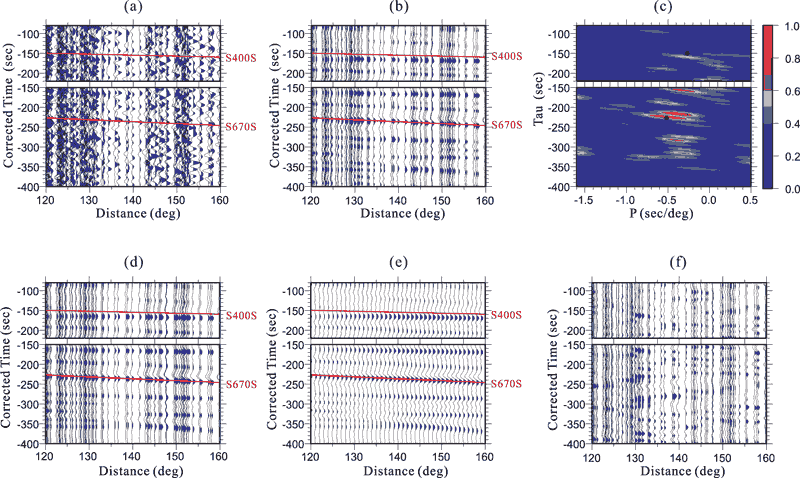
of SS precursors. Figure 1 illustrates
the basic procedure in our analysis of sub-hotspot
mantle. We
analyze the transverse components of teleseismic (100-160°)
recordings and group the source-receiver pairs whose
geometrical reflection points fall within 10° of
a given hotspot location (Figure 1a). Rather
than relying on a low-resolution cap averaging approach,
we compute the running average of records with distances
of 20° to pre-condition each data set (Figure 1b). Then,
through regularized least squares inversions, we determine
the time-distance relationships of SS precursors
based on the energy foci in the τ - p model. The
recovered (predicted; Figure 1d) and spatially interpolated
(Figure 1e) time series represent the “cleaned
up” versions of the original data, while random
noise and interfering phases outside of the ray parameter
and time ranges of the SS precursors (Figure
1f) have been minimized. We measure the differential
time τ and the ray
parameter p of SdS-SS (d for
a discontinuity) exclusively in the Radon domain.
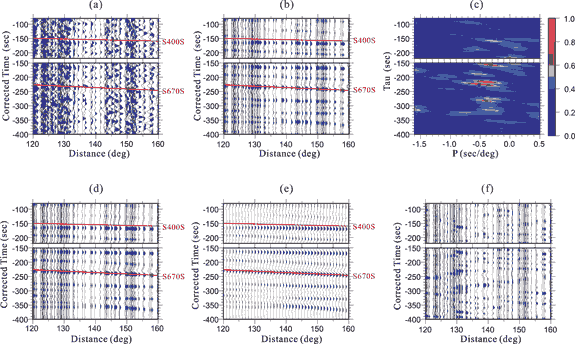
Figure 1. The
process of Radon transform for the Hawaii hotspot.
(a) The original time series after alignment and
normalization on SS. Topographic,
crustal and heterogeneity corrections have been applied.
(b) The time series after partial stacking using 20° distance
windows. (c) A non-quadratic Radon transform is performed
to constrain the τ - p model. (d) The predicted data with
Radon operator in (c). (e) Reconstructed seismograms
after resampling and interpolation with same Radon
operator shown in (c). (d) The residual between the
data and Radon model predictions. Signals have been
exaggerated for clarity. Click here for
enlargement.
|
Results
Using
the abovementioned approach we examined 17 hotspots
characterized by a score of 2 or higher in Courtillot
et al. (2003). The
depth of the 410-km discontinuity, as inferred
from our measurements, is generally deeper at
the hotspot locations (416 km) relative to the
global average of 410 km (Figure 2a). This
observation corroborates the time-domain observations
of Gu
et al. (2003) and Deuss (2007). Out
of all the examined hotspots, a shallower-than-average
410-km discontinuity is only observed beneath
Iceland, which we interpret as evidence of a “shallow” hotspot
(Du
et al.,
2006). The transition zone
thickness is dominated by the locally depressed
410-km discontinuity and its average beneath
hotspot locations (237 km) is 5-km thinner than
the global average (Gu
et al., 2003;
Figure 2b). The
regional thickness variations inferred from Pds (higher
resolution) and SdS (this study)
are remarkably consistent (see Figure 2b), and
underline the need for the sixth criterion (see Deuss,
2007) in differentiating deep-rooted hotspots
from shallow ones.
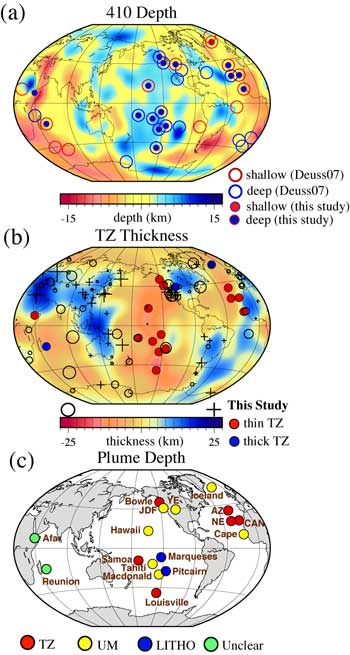
Figure 2. (a)
The depth of the 410-km discontinuity. The
contour map shows the interpolated results of
Gu
et al. (2003). The
solid circles represent the results of this paper
(only sign information relative to the global average
of 410 km is given). The unfilled circles
show the results from Deuss
(2007) (without amplitude
information). (b) Transition zone thickness
variations. The contour map shows the results
of Gu & Dziewonski
(2002; low resolution). The
black symbols compare the recent thickness map
of Lawrence & Shearer
(2006; from high resolution
receiver functions) with the regional map of this
study (colored circles). The results from
all three studies are well correlated. (c) Proposed
plume depth from this study. TZ – transition
zone or deeper, UM – upper mantle, LITHO – lithospere,
Unclear – depth not well resolved. |
Discussion
Perturbations of S410S-SS ray
parameters present the most revealing observations
relevant to the search for hot thermal anomalies
(Figure 3a). We
identify both positive and negative jumps in travel
time curves (and thus in ray parameters) for
rays bottoming beneath hotspots (Figure 3b). This
can be explained using two idealized conceptual models
(Figure 4). If a low velocity column
exists in the upper mantle beneath a hotspot (Figure
4a), then shorter SS waves (with larger
ray angles near the reflection points) would slow down
precipitously with increasing ray lengths within the
column. This phenomenon is relatively short-lived,
as travel times stabilize near the center of the anomaly
(which is expected to be slower seismically, if it
corresponds to a plume) and increase gradually at longer
distances. This simple model can explain sufficiently
the travel time observations associated with the Hawaii,
Tahiti, Macdonald, Juan de Fuca, Cape Verde, Yellowstone,
and Iceland hotspots. Should
a low-velocity perturbation extend into the transition
zone, its predicted effect on S410S would
offset or overcome that on SS, thereby producing
a “flat” or positive differential ray parameter
at shorter distances. Low-velocity anomalies at the
Azores, Samoa, Louisville, Canary, New England and
Bowie hotspots appear to agree with this model. If
due to thermal variations, the epicentral distance
at which the abrupt change in differential ray parameter
occurs will reflect the temperature gradient and width
of the anomaly. Hotspots
that exhibit smooth, PREM-like distance-time relationships,
for example Pitcairn and Marqueses islands (not shown),
are more likely to originate from lithospheric processes.
Our data coverage is insufficient in the distance range
100-130° to determine accurately the transition
zone characteristics beneath Afar and Reunion.
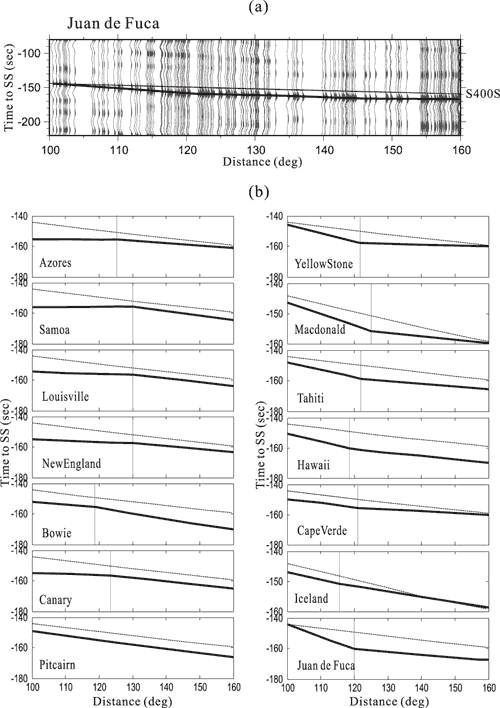
Figure 3. (a)
An example showing a characteristic change in the
differential ray parameter, equivalent to a significant
jump in the travel time curve. (b) Detailed
distance-time relationships for S410S-SS for the
majority of hotspot locations. The dotted line
represents the travel time curves based on PREM (Dziewonski
& Anderson, 1981). The dark solid lines denote
the travel time observation from our spatially reprocessed
data.
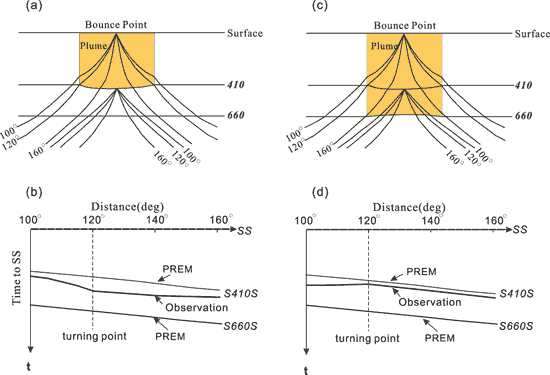
Figure 4. Two
conceptual models illustrating positive and negative
changes in ray parameters of S410S-SS across the distance
range of 100-160°. If the anomalies are due
to plumes, then the amount of “bending” and
the distance where it occurs reflect the temperature
and lateral dimension of the hot thermal anomalies.
Travel time perturbations
of S670S are
known to correlate with the global distribution of
subduction zones (Shearer &
Masters, 1992), but
their effectiveness in constraining anomalies
at or below the upper mantle transition zone is
compromised by potential compositional variations
and the majorite-garnet phase transition (Hirose,
2002;
Deuss,
2007). The
depths inferred for the 660-km discontinuity from the
Radon inversions vary substantially and are, in general,
inconsistent with those expected from the olivine
γ-spinel to silicate perovskite and magnesiowüstite
transformation (Anderson, 1967) at high
mantle temperatures. Furthermore,
the differential ray parameter of S660S-SS is
surprisingly uneventful throughout the examined distance
range. The lack of a characteristic change in p may
suggest the absence of significant anomalies
immediately below the 660-km phase boundary, though
complexities associated with the garnet phase transformation
and waveform interference from ScSdScS and
sdsS cannot
be ignored (Schmerr & Garnero,
2006).
Lastly,
the presence of mid-mantle reflectors have been suggested
as potential evidence of compositional stratification
beneath some hotspot locations (Shen
et al.,
2003). In an attempt to link lower/mid-mantle reflectors
with hotspots, we conducted a systematic search in
time and Radon domain for such reflectors
(Figure 5). We identify clear τ - p maxima
corresponding to 900-1000 km reflectors beneath Hawaii,
Louisville, Tahiti, Juan de Fuca, Canary and Macdonald
islands, a list that includes both hotspots that apparently have
upper-mantle origins and those apparently rooted in the transition-zone
or deeper, as discussed above. We also observed additional
mid-mantle reflectors beneath
non-hotspot locations in the northern Pacific, which
leads us to believe that the presence of mid-mantle
reflectors is more common than was previously thought
and their spatial distribution does not correlate
with the locations of hotspots.
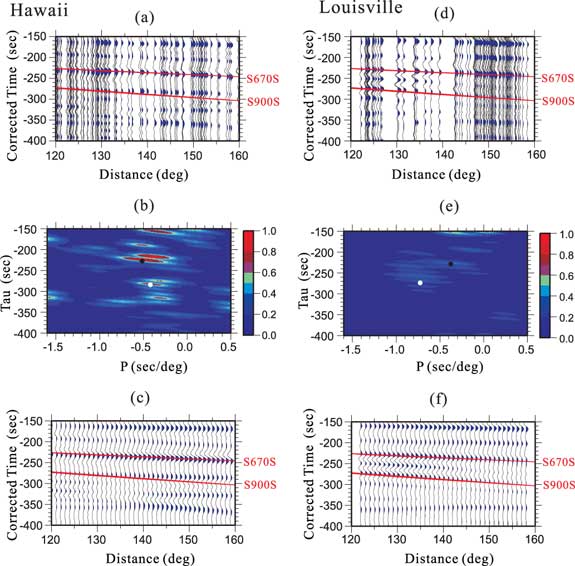
Figure
5. Examples
of lower-mantle reflectors deeper than 850 km.
Similar lower/mid-mantle reflectors have been observed
beneath a significant fraction of hotspots
as well as under non-hotspot locations.
Summary
Our study
highlights the importance of the 410-km discontinuity
as a mantle plume tracer. The
phase boundary is generally depressed beneath hotspots,
and a discontinuous travel-time curve provides powerful
constraints on the possible depths of hot thermal plumes. Among
17 potential plume locations that we studied, we
confidently identify the Azores, Samoa, Louisville,
Canary, New England and Bowie hotspots as being underlain
by anomalies that are relatively deep, i.e.,
within the transition zone and potentially deeper. Pitcairn
and Marqueses hotspots show no indication of underlying
anomalies, as evidenced by the lack of change in the S410S-S660S ray
parameters, only mild depression of the 410-km discontinuity,
and relatively normal transition zone thicknesses. Our
study also suggests a shallowly rooted Iceland hotspot
(see also Du
et al.,
2006), from both an anomalously
shallow 410-km discontinuity and a positive change
in the S410S-SS distance-time
relationship.
Acknowledgements
We thank Mauricio Sacchi
for technical help. We are also grateful to Gillian
Foulger for the invitation to contribute and for many
valuable suggestions and comments. This work is supported
by Alberta Ingenuity, Canadian Foundation for Innovation
(CFI) and NSERC.
References
-
An, Y., Gu, Y. J., and M. Sacchi,
M., 2007, Imaging mantle discontinuities using
least-squares Radon transform,
J. Geophys. Res., submitted.
-
Anderson, D. L., 1967, Phase changes in the upper
mantle, Science, 157, 1165-1173.
-
Courtillot,
V., Davaille, A., Besse, J., and Stock, J., 2003,
Three distinct types of hotspots in the Earth’s
mantle, Earth Planet. Sci. Lett., 205, 295-308.
-
-
-
Du,
Z., Vinnik, L. P., and Foulger, G. R., 2006, Evidence
from P-to-S mantle converted waves for a flat “660-km” discontinuity
beneath Iceland, Earth Planet. Sci. Lett., 241, 271-280.
-
Dziewonski, A.M., and D.L. Anderson, 1981, Preliminary
reference Earth model, Phys. Earth. Planet.
Int., 25,
297-356.
-
-
Gu,
Y. J., Dziewonski, A. M., and Ekström,
G., 2003, Simultaneous inversion for mantle shear
velocity and topography of transition zone discontinuities, Geophys. J. Int., 154,
559-583.
-
-
Hirose, K., 2002, Phase transitions in pyrolitic mantle
around 670-km depth: implications for upwelling of
plumes from the lower mantle. J.
Geophys. Res., 107,
doi:10.1029/2001JB000595.
-
-
Montelli, R., Nolet, G., Dahlen, F. A., and Masters,
G., 2006, A catalogue of deep mantle plumes: New
results from finite-frequency tomography, Geochem.
Geophys. Geosys., 7, 1-69.
-
Morgan, W. J., 1971, Convection plumes in the lower
mantle, Nature, 230, 42-43.
-
-
-
Shen, Y., Wolfe, C. J., and Solomon, S. C., 2003,
Seismological evidence for a mid-mantle discontinuity
beneath Hawaii and Iceland, Earth
Planet. Sci. Lett., 214,
143-151.
-
last updated 2nd
April, 2007 |