 |
Anomalous mantle transition zone beneath the Yellowstone hotspot track |
Ying Zhou
Department of Geosciences, Virginia Tech, Blacksburg, VA; yingz@vt.edu
This webpage is a summary of Zhou, Y. (2018), Anomalous mantle transition zone beneath the Yellowstone hotspot track, Nature Geoscience, 11, 449-453.
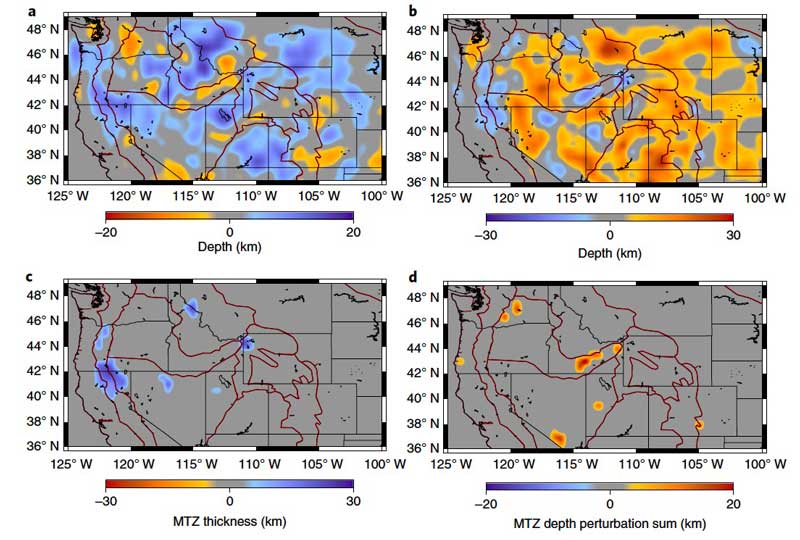
The origin of Yellowstone and Snake River Plain volcanism has been strongly debated [refs 1, 2]. In this study, I apply newly developed diffractional imaging theory for receiver functions to obtain high-resolution topography of the 410-km and 660-km discontinuities in the Western United States. The new models (Figure 1) show that:
-
The most prominent large-scale feature is that overall both discontinuities are deeper in the Western US. This can be explained by thermal anomalies inferred from seismic wavespeed models: the upper mantle is warm (slow) and the lower MTZ is cold (fast) due to the presence of the stagnant Farallon slab.
-
The most striking small-scale feature is a trail of anomalies beneath the Snake River Plain where both discontinuities are shallower. This MTZ anomaly trail closely follows the surface volcanic track. This observation is in disagreement with the predictions of the plume model, which require the discontinuity anomalies to be confined to a narrow region directly beneath the present-day Yellowstone caldera.

Figure 1: Mantle transition-zone discontinuities from receiver function diffraction tomography. (a) and (b) are depth perturbations of the 660- and 410-km discontinuities, plotted on different (reversed) color scales. (c) Thicker MTZ where the two discontinuities are anti-correlated and perturbations are larger than uncertainties (3 km for the 660-km- and 5 km for the 410-km discontinuities). The anomalies can be explained by a possible vertical slab throughout the MTZ, except for the anomaly at Yellowstone where the thicker MTZ corresponds to the trench of the reversed polarity subduction. (d) The sum of discontinuity-depth perturbations where both discontinuities are shallower, which is indicative of possible vertical upwellings through a hydrated MTZ. Click here or on Figure for enlargement.
The MTZ anomaly track was puzzling until mantle wave speed models in the Western US were re-examined (Figure 2). The location of the anomalies correlates well with a slab gap in wave speed structure [ref 3].
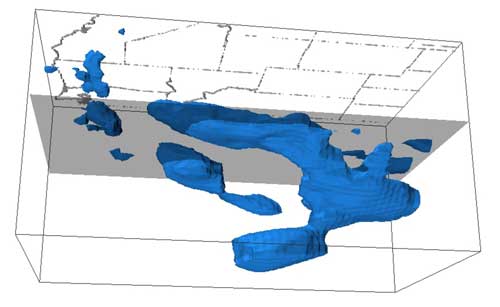
Figure 2: 3D rendering and re-examination of S-wave slab anomalies in the western United States. The isosurface represents 1% fast seismic wave-speed anomalies in the 50-1,600 km depth range [ref. 10]. US state boundaries are plotted at the surface for geographical reference. Fast anomalies in the upper mantle beneath the craton are removed for better illustration of the slab. The horizontal plane in grey is plotted at a 660 km depth for reference. A cartoon representation of this figure is shown in Figure 3d.
In addition, when only positive wave speed anomalies are plotted, it reveals a section of torn slab with its east end in the MTZ beneath Yellowstone and its west end sunk to about 1200 km depth. I propose an alternative interpretation of Yellowstone volcanism that explains both seismic wavespeed and discontinuity structure in the MTZ (Figure 3):
- About 30 million years ago when subduction of the Farallon plate was stagnant in the mantle transition zone, the mid-ocean ridge that separates the Pacific and Farallon plates approached the North American plate.
- By about 25 million year ago, this mid-ocean ridge had subducted and the boundary between the North American plate and the Pacific Plate became transform. South of the Mendocino Fracture Zone, the slab broke off from the subducted spreading centre in the shallow mantle. The upper slab stayed in the shallow mantle [ref 4] whereas the lower slab (which was not coupled to the surface plate) sank at the relatively fast rate of about 5 cm per year.
- About 16 million year ago, the lower slab reached the MTZ. As it was weakly coupled to the northern slab through the Mendocino Fracture Zone, slab tearing occurred along the Mendocino Fracture Zone and the Pioneer Fracture Zone. The section of slab between the two fracture zones sank further into the lower mantle, causing the polarity of subduction to reverse with younger slab in the lower mantle pulling down older, stagnant slab in the MTZ. This reversed-polarity subduction started from the west end and propagated northeastward along the Yellowstone anomaly track.
- The deepest slab in this reversed-polarity subduction system has reached about 1,200 km, indicating a vertical sinking speed of about 3.5 cm per year in the lower mantle. The rest of the stagnant slab beneath the western United States has been gradually dragged down to about 700–800 km and dips to the east with normal subduction polarity (Figure 2). The reversed-polarity subduction induced strong passive upwellings from the lower mantle which rose through a MTZ containing high water content imparted by the stagnant slab. Dehydration melting occurs as the upwellings cross the 410 km discontinuity. The melt further rises up in a superadiabatic upper mantle and leads to surface volcanism. This model explains the lower-mantle signature of the 3He/4He isotope ratios observed in the basaltic volcanism, the shallower 410 and 660 along the MTZ anomaly track, and the absence of a lower-mantle plume tail in seismic images. Seismic wave-speed structure also supports an early slab breaking-off event as well as the sequential tearing and reversed-subduction-polarity events.
Figure 3: Cartoon illustrating stages of subduction in the Western US (not to scale). (a) >30 Ma: stagnant slab subduction. MFZ: Mendocino Fracture Zone. (b) ~25 Ma: ridge subduction and slab break-off. (c) ~16 Ma: reversed subduction (polarity reversal). (d) Present-day slab geometry as seen in Figure 2–slab tearing along the Mendocino and Pioneer Fracture Zones. For simplicity, the Pioneer Fracture Zone is not illustrated in (a) or (b) but is indicated by a dashed line in (c).
The spacing between the Mendocino and Pioneer Fracture Zones is about 150 km, which is roughly the width of the Yellowstone anomaly trail. Unlike in the Atlantic Ocean where fracture zones often show simple symmetry, fracture zones on the North American Plate and their “conjugates” on the subducted Farallon Plate had different orientations. This suggests complex evolution of fracture zones on the Farallon Plate, possibly related to the break-up of the Farallon Plate into smaller microplates. For example, in the Southern Pacific where seafloor records on the remnant Farallon Plate have not been subducted, the Mendãna Fracture Zone on the Nazca Plate and the Orozco Fracture Zone on the Cocos Plate both show orientations very different from their conjugates on the Pacific Plate due to the formation and rotation of a short-lived Bauer microplate and re-orientation of the East Pacific Rise [refs 5, 6]. It is worth mentioning that slab windows in the Western US are probably associated with fracture zones on the Pacific plate not their conjugates on the Farallon plate.
The close proximity between the anomaly track in the MTZ and locations of surface Neogene volcanism indicates that the absolute movement of the North American Plate in the past 16 million years was 1–2 cm per year or less. This is comparable to the seafloor-spreading rate in the North Atlantic Ocean and much smaller than estimates obtained from caldera locations using a simple mantle plume model. In global reconstruction models, the absolute plate motion of the North American Plate varies between ~1 cm per year and ~2.5 cm per year depending on the reference frame [ref 7], in general agreement with our model.
As final note concerning methodology, the MTZ anomaly track was imaged when finite-frequency sensitivity kernels [ref 8] were applied in discontinuity tomography. The track was a robust feature in both the 410- and 660-km maps before wavespeed corrections were made. Applying wavespeed corrections only makes the feature stronger [ref 9, supplementary data]. When the same dataset was subject to ray theory back-projection imaging the MTZ anomaly track was not detected. This confirms the importance of properly accounting for diffractional effects in seismology when imaging small objects.
References
-
Morgan, W. J. Deep mantle convection plumes and plate motions. Bull. Am. Assoc. Pet. Geol. 56, 203–213 (1972).
-
Christiansen, R. L., Foulger, G. R. & Evans, J. R. Upper-mantle origin of the Yellowstone hotspot. Geol. Soc. Am. Bull. 114, 1245–1256 (2002).
-
Sigloch, K., McQuarrie, N. & Nolet, G. Two-stage subduction history under North America inferred from multiple-frequency tomography. Nat. Geosci. 1, 458–462 (2008).
-
Wang, Y. et al. Fossil slabs attached to unsubducted fragments of the Farallon plate. Proc. Natl. Acad. Sci. USA 110, 5342–5346 (2013).
-
Goff, J. A. & Cochran, J. R. The Bauer scarp ridge jump: a complex tectonic sequence revealed in satellite altimetry. Earth. Planet. Sci. Lett. 141, 21–33 (1996).
-
Lynn, W. S. & Lewis, B. T. R. Tectonic evolution of the northern Cocos plate. Geology 4, 718–722 (1976).
-
Muller, R. D. et al. Ocean basin evolution and global-scale plate reorganization events since Pangea breakup. Annu. Rev. Earth. Planet. Sci. 44, 107–138 (2016).
-
Deng, K. & Zhou, Y. Wave diffraction and resolution of mantle transition zone discontinuities in receiver function imaging. Geophys. J. Int. 201, 2008–2025 (2015).
-
Zhou, Y. Anomalous mantle transition zone beneath the Yellowstone hotspot track, Nat. Geosci. 11, 449–453 (2018).
-
Tian, Y., Zhou, Y., Sigloch, K., Nolet, G. & Laske, G. Structure of North American mantle constrained by simultaneous inversion of multiple frequency SH, SS, and Love waves. J. Geophys. Res. 116, B02307 (2011).
last updated 8th
January, 2019 |