 |
Crustal
seismology helps constrain the nature of mantle
melting anomalies: The Galápagos Volcanic
Province |
Valentí
Sallarès1,*, Philippe
Charvis1, Ernst R. Flueh2,
Joerg Bialas2 and the SALIERI Scientific
Party
1IRD-Géosciences
Azur, B.P. 48, 06235-Villefranche-sur-Mer, France
2IFM-GEOMAR,
Leibniz Institut for Marine Sciences, Kiel and SFB574
of CAU, Kiel, 1-3 Wischhofstrasse, 24148-Kiel, Germany
*Now
at: Unitat de Tecnologia Marina – CMIMA –
CSIC Passeig Marítim de la Barceloneta 37-49,
08003 – Barcelona, Spain, Tel: +34-932309623 vsallares@utm.csic.es
 Click here to
download a PDF version of this webpage Click here to
download a PDF version of this webpage
Abstract
In this paper we advocate
the combination of crustal seismology and gravity with
petrology as a promising approach to help constrain
the nature of mantle melting anomalies. We compare seismic
velocity and density models of the crust and uppermost
mantle along five transects crossing the Cocos, Carnegie,
and Malpelo ridges in the Galápagos Volcanic
Province (GVP). A remarkable, systematic observation
in the velocity profiles is an overall anti-correlation
between lower-crustal velocity and crustal thickness.
Velocity-derived density models account for the gravity
and depth anomalies assuming uniform mantle densities,
indicating that the ridges are isostatically compensated
at the base of the crust. A 2D steady-state mantle melting
model is applied to illustrate that it is difficult
to account for the seismic structure of the ridges if
it is assumed that the main source of the Galápagos
hotspot is a thermal anomaly, even if vigorous mantle
upwelling coupled with deep, damp melting is included
in the model. It is easier to account for the observations
if a major element heterogeneity, is also considered.
We thus suggest that the primary source of the Galápagos
hotspot may be a compositional heterogeneity, possibly
a mixture of depleted mantle and recycled oceanic crust.
Such a mantle source explains well the isotope and trace
element patterns showed by GVP basalts.
This webpage is a summary
of the work described in Sallarès
et al. (2005).
1.
Introduction
The origin of large igneous
provinces is usually explained by hot mantle plumes
rising from the deep mantle, whose surface imprint is
referred to as a “hotspot” (Morgan,
1971). The thermal plume model asserts that a hot,
rising plume enhances mantle melting, and that the excess
melting is mostly emplaced as igneous crust (White
& McKenzie, 1989). The primary support for
this hypothesis is the thick crust of igneous provinces
when compared with normal oceanic crust. Additional
arguments supporting the plume model include the composition
of hotspot basalts, which is akin with that expected
for melting of hotter-than-normal mantle (e.g.,
White et al., 1992), the high-velocity crustal
roots frequently found beneath oceanic plateaus, volcanic
margins (e.g., Kelemen & Holbrook, 1995),
and low-velocity anomalies extending from the surface
to the lower mantle shown in global tomography models
(e.g., Montelli
et al.,
2004).
Despite the wide acceptance
of the thermal plume model, several alternatives have
been proposed. The “small-scale convection”
model postulates that systems cooled from above feature
lateral temperature contrasts which result in small-scale
convection up to an order of magnitude faster than plate
motions (Korenaga
& Jordan,
2002). It has been also demonstrated that rifting
may induce dynamic convection within the mantle as well
(Boutillier
& Keen,
1999). Mantle plumes may also include a significant
proportion of lower melting components, such as eclogite
derived from recycled oceanic crust (e.g., Campbell,
1998). The importance of major-element source heterogeneity
in accounting for the excess melting has been highlighted
for a number of hotspots (e.g., Hauri, 1996).
Moreover, recent seismic experiments show that high-velocity
crustal roots are absent in several cases (e.g.,
Korenaga
et al.,
2000), and no local tomography studies yet performed
in Iceland show compelling evidence for a velocity anomaly
extending deeper than the mantle transition zone (e.g.,
Foulger
et al.,
2001).
The GVP constitutes a
well-studied example of an igneous province generated
by the interaction between the Galápagos hotspot
(GHS) and the Cocos-Nazca Spreading Center (CNSC). Different
geophysical studies based on gravity analysis, seismic
data, and numerical modelling suggest that the GHS is
a thermal anomaly (e.g., Ito
et al.,
1997; Canales
et al.,
2002), and receiver-function analysis claims that
the associated mantle plume extends deeper than the
mantle transition zone (Hooft
et al.,
2003). Available global tomography models do not
show, however, any Galápagos-linked anomaly going
deeper than the base of the upper mantle (e.g.,
Montelli
et al.,
2004). In this paper, We first show seismic tomography
models along two profiles acquired in the GVP (Figure
1). Velocity-derived density models are subsequently
constructed to determine the mantle density structure
that best fits gravity and topography data. We finally
develop a 2D steady-state mantle melting model that
has been used to infer the nature of the GHS based on
the velocity models.
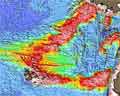
Figure 1. Location map of
the study zone showing the residual bathymetry
derived from seafloor age. Numbers show crustal
ages of the ocean floor at 5 Ma intervals. Large
arrows indicate plate motions. Black lines show
locations of the wide-angle seismic profiles
(P1: W Carnegie, P2: E Carnegie, P3: Malpelo,
P4: N Cocos, P5: S Cocos). Boxes outline the
seismic experiments PAGANINI-1999 and SALIERI-2001.
CNSC: Cocos-Nazca Spreading Centre, GHS: Galápagos
hotspot, PFZ: Panama Fracture Zone.
|
2.
Seismic tomography
The seismic data set used
in this study comprises two wide-angle profiles crossing
the Carnegie Ridge acquired during the SALIERI-2001
experiment (Flueh et al., 2001), and three
other transects crossing Cocos and Malpelo, acquired
in the PAGANINI-1999 survey (Figure 1). All lines were
covered by densely spaced OBS/H. Two-dimensional (2D)
velocity models were estimated using the joint refraction
and reflection traveltime inversion method of Korenaga
et al.
(2000). The uncertainties in the model parameters
were estimated by performing a Monte Carlo-type analysis
described by Sallarès
et al.
(2005).
The velocity structure
obtained is very similar along all the profiles (Sallarès
et al., 2003,
2005).
The velocity of Oceanic Layer 2 shows a prominent vertical
gradient, but velocity is much more uniform in Layer
3. This layer accommodates most of the crustal thickening.
Surprisingly, the lowest Layer 3 velocities are systematically
found where the crust is thickest. Maximum crustal thickness
is ~13 km along profile 1, ~19 km along profile 2 (Figure
2), and ~16.5 km and ~19 km respectively along their
conjugate profiles. Crustal thickness variations reveal
that the magmatic rate of the GHS on both sides of the
CNSC changed with time, and allow temporal variations
in the relative distance between the GHS and the CNSC
to be calculated (Sallarès
& Charvis,
2003). The velocity uncertainties estimated from
the Monte Carlo analysis are lower than 0.1 km/s in
most parts of the models, and the depth uncertainties
are generally lower than 0.3-0.4 km. The accuracy of
the results was checked by repeating the inversion twice
using only half the data in each case. Both solutions
are very similar, confirming the consistency of the
data set. The velocity anomalies are thus real features
and inversion artefacts, if present, are minor.
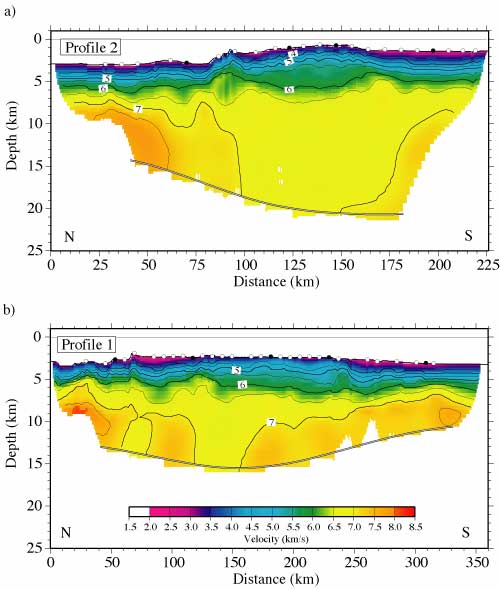
Figure 2. Seismic tomography
results. Final averaged velocity models from
100 Monte Carlo ensembles. Open circles indicate
OBS/OBH locations along profiles. (a) P2, and
(b) P1, in Figure 1.
|
3.
Gravity and compensation of topography
Gravity analyses were
performed along profiles 1, 3 and 5 (Figure 1) to calculate
the velocity-derived crustal density structure and the
range of mantle density anomalies required to explain
the gravity and topography data. Gravity profiles were
constructed using available marine gravity data based
on satellite altimetry (Sandwell
& Smith, 1997). A method based on the spectral
method of Parker (1972) was employed to calculate
the gravity anomaly produced by a heterogeneous 2D density
model. Velocity was converted to density using different
empirical conversion laws for sediments and oceanic
crust (Carlson & Herrick, 1990). The velocity-derived
density models explain well the observed gravity anomaly
along all the profiles, indicating that the velocity
model is compatible with the gravity data without requiring
mantle density anomalies.
A bathymetric data analysis
was performed subsequently. Topography compensation
studies assume isostatic equilibrium either as a result
of crustal thickness variations, mantle density variations,
or, more likely, a combination of both. Lateral crustal
density variations contribute significantly to the gravity
anomaly, so these were included in the calculations
(Sallarès
et al.,
2005). The results show that the contribution of
lateral crustal density variations to the depth anomaly
is also significant. Predicted mantle density anomalies
for the variable crustal density models along the transects
are negligible for a wide range of compensation depths,
indicating that swell anomalies are isostatically compensated
at the base of the crust (Figure 3). Mantle density
anomalies, if present, are beneath the uncertainty threshold
of the method.
Figure 3. Mantle density variations
along transect P5, inferred from the isostasy
model, for different compensation depths (Z=50,
100, 150, 200 km). Shaded stripes show mantle
density uncertainties for each compensation
depth. Dashed lines correspond to uniform crustal
density models (2800 kg/m3) with
the same Moho geometry.
|
4.
Mantle melting model
McKenzie & Bickle
(1988) demonstrated that the 6-7 km thick, MORB-like
composition oceanic crust that normally is produced
at spreading centers is the result of decompression
melting of a ~1300°C potential temperature dry pyrolite
mantle source. Higher mantle temperatures or compositional
anomalies may cause buoyant upwelling of the mantle,
enhancing melting and producing, eventually, a thicker
crust. It has also been suggested that deep, damp melting
of a volatile-bearing mantle may produce a significant
part of the total volume of melt, even if the melting
rate is an order of magnitude lower than that of shallow,
dry melting (Braun
et al.,
2000), if it is coupled with vigorous upwelling
at the base of the melting zone (e.g., Maclennan
et al.,
2001).
A 2D steady-state mantle
melting model that includes the effect of mantle temperature,
deep damp melting, active upwelling beneath the dry
solidus, and mantle source composition, was developed
in order to quantify the relative importance of the
melting parameters to the seismic structure of the
resultant igneous crust. The model is based on the
1D model of
Korenaga
et al.
(2002), in which a connection between mantle melting
parameters and resultant crustal structure is established
on the basis of an empirical relationship between
crustal velocity and mean pressure and degree of melting.
A description of the method and the different parameters
can be found in Sallarès
et al.
(2005). Several sample calculations were performed
that consider different values for the parameters
involved (Figure 4). The different panels of Figure
4 correspond to so-called H-Vp diagrams. These display
the predicted velocity obtained using the multilinear
regression method of Korenaga
et al.
(2002) and the mean depth and fraction of melting
derived from our model, versus crustal thickness,
as a function of mantle potential temperature and
upwelling ratio. Crustal thickness and lower crustal
velocity values obtained along the profiles are superimposed.
The main conclusion is that the results cannot be
explained by deep damp melting coupled with active
upwelling only. Low mantle potential temperatures
are always required to account for the observed H/Vp
anti-correlation, which is both counter-intuitive
and difficult to justify. It is thus necessary to
consider alternatives to the homogeneous, hot mantle
model in order to explain this observation.
Figure 4. H-Vp diagrams corresponding
to different melting parameters. Crustal thickness
is plotted versus mean Layer 3 velocity. Values
are taken from the velocity models along the
five profiles: P1 (blue), P2 (white), P3 (red),
P4 (yellow), P5 (green). Thin lines indicate
mantle potential temperatures, and thick lines
indicate upwelling ratio. Melting parameters:
(a) Γd=15 %/GPa, Γw=1 %/GPa, α=0.25,
ΔZ=50 km, pyrolite, (b) Γd=15 %/GPa,
Γw=2 %/GPa, α=1, ΔZ=50 km, pyrolite,
(c) Γd=20 %/GPa, Γw=1 %/GPa, α=0.25,
ΔZ=75 km, pyrolite, (d) same as (c) but
with a source composed by 30% MORB and 70% depleted
mantle. NOC: Normal CNSC-oceanic crust. Click
here for enlargement.
|
An alternative model to
be examined is the possible presence of compositional
anomalies in the mantle source, as indicated by isotopic
and trace element geochemistry of basalt samples from
the Galápagos platform (e.g., White et al.,
1993), the axis of the CNSC (e.g., Schilling et
al., 2003), and the aseismic ridges (e.g,.
Hoernle
et al.,
2000). However, too few melting experiments with
source compositions other than pyrolite exist to develop
a quantitative model including the effect of source
heterogeneities. Following Korenaga
et al.
(2002), a test was performed that considered a hypothetical
source composed of 70% pyrolite and 30% MORB, combined
with higher melt productivity and a 50°C lower temperature
in the solidus to reflect Fe enrichment (Figure 4d).
The results indicate that the seismic structure of the
thickest crustal segments are more easily explained
by passive to moderately active upwelling of normal
temperature but fertile mantle rather than by a hot
(or wet) homogenous pyrolitic mantle. Melting of recycled
subducted oceanic crust could explain the observed isotope
and trace element patterns, as well as the crustal thickening
and the anti-correlation between crustal thickness and
seismic velocity, without need for anomalously high
mantle temperatures. A contribution of extra melting
from a deep, hydrous root is probably needed (Cushman
et al.,
2004). Melting experiments to study mantle source
compositions different from dry pyrolite are required,
however, to quantify the relative significance of “fertile”
versus “damp” melting in the source of the
GVP.
References
-
-
-
Campbell,
I.H., 1998. The mantle’s chemical structure:
insights from the melting products of mantle plumes,
In: Jackson, I. (ed) The Earth’s mantle:
composition, structure and evolution, Cambridge
University Press, Cambridge, pp. 259-310.
-
Canales,
J.P., Ito, G., Detrick, R.S. & Sinton, J., 2002.
Crustal thickness along the western Galápagos
Spreading Center and compensation of the Galápagos
Swell, Earth Planet. Sci. Lett., 203,
311-327.
-
Carlson, R.L.
& Herrick, C.N., 1990. Densities and porosities
in the oceanic crust and their variations with depth
and age, J. Geophys. Res., 95,
9153-9170.
-
Cushman,
B.J., J.M. Sinton, G. Ito, & J.E. Dixon. 2004.
Glass compositions, plume-ridge interaction, and
hydrous melting along the Galápagos Spreading
Center, 90°30'W to 98°W, Geochem. Geophys.
Geosys., 5, doi:10.1029/2004GC000709.
-
Flueh, E.R,
Bialas, J., Charvis, P. & the Salieri Scientific
Party, 2001. Cruise report SO159 SALIERI,
211 pages, GEOMAR, Kiel.
-
-
Hauri, E.H.,
1996. Major element variability in the Hawaiian
mantle plume, Nature, 382,
415-419.
-
Hoernle,
K.A., Werner, R., Phipps-Morgan, J., Bryce, J. &
Mrazek, J., 2000. Existence of complex spatial zonation
in the Galápagos plume for at least 14.5
Ma, Geology, 28, 435-438.
-
-
Ito,
G., Lin, J. & Gable, C.W., 1997. Interaction
of mantle plumes and migrating mid-ocean ridges:
Implications for the Galápagos plume-ridge
system, J. Geophys. Res., 102,
15403-15417.
-
Kelemen, P.B.
& Holbrook, W.S., 1995. Origin of thick, high-velocity
igneous crust along the U.S. East Coast margin,
J. Geophys. Res., 100, 10077-10094.
-
Korenaga,
J., Holbrook, W.S., Kent, G.M., Kelemen, P.B., Detrick,
R.S., Larsen, H.-C., Hopper, J.R. & Dahl-Jensen,
T., 2000. Crustal structure of the southeast Greenland
margin from joint refraction and reflection seismic
tomography, J. Geophys. Res., 105,
21591-21614.
-
-
Korenaga,
J., Kelemen, P.B. & Holbrook, W.S., 2002. Methods
for resolving the origin of large igneous provinces
from crustal seismology, J. Geophys. Res.,
107 (B9), 2,178, doi:10.1029/ 2001JB001030.
-
-
McKenzie,
D. & Bickle, M.J., 1988. The volume and composition
of melt generated by extension of the lithosphere,
J. Petrol., 29, 625-679.
-
Montelli,
R., Nolet, G., Dahlen, F. A.., Masters, G., Engdahl,
& Hung, S.-H. 2004. Finite-Frequency Tomography
reveals a variety of plumes in the mantle, Science,
303, 5656, 338-343.
-
-
Parker, R.L.,
1972. The rapid calculation of potential anomalies,
Geophys. J. R. Astron. Soc., 31,
447-455.
-
-
Sallarès,
V., Charvis, Ph., Flueh, E. R. & J. Bialas,
2003. Seismic structure of Cocos and Malpelo ridges
and implications for hotspot-ridge interaction,
J. Geophys. Res., 108,
2564, doi: 10.1029/2003JB002431.
-
-
-
White, R.S.
& McKenzie, D., 1989. Magmatism at rift zones:
The generation of volcanic continental margins and
flood basalts, J. Geophys. Res., 94,
7685-7794.
-
White, R.S.,
McKenzie, D. & O’Nions, R.K., 1992. Oceanic
crustal thickness from seismic measurements and
Rare Earth Element inversions, J. Geophys. Res.,
97, 19683-19715.
-
White, W.M.,
McBirney, A.R. & Duncan, R.A., 1993. Petrology
and geochemistry of the Galápagos islands:
Portrait of a pathological mantle plume, J.
Geophys. Res., 98 (11), 19533-19563.
|