 |
Sedimentary
Evidence for Moderate Mantle Temperature Anomalies Associated
with Hotspot Volcanism
|
 |
|
Peter
D. Clift
Department
of Geology and Petroleum Geology, School of Geosciences,
Meston Building, King's College, University of Aberdeen,
Aberdeen AB24 3UE, United Kingdom
pclift@abdn.ac.uk
|
| Abstract
One of the characteristics
of deep-rooted mantle plume models and their associated excess hotspot
volcanism is the presence of anomalously hot asthenosphere underlying
the lithospheric plates. The emplacement and dispersal of hot asthenosphere
is predicted to cause faster subsidence of hotspot crust compared to that
seen in normal oceanic crust. However, studies of the sedimentary cover
from a range of seamounts, plateaus and ridges of various ages from all
major ocean basins show either no or only moderate anomalous additional
subsidence that can be linked to hot asthenosphere during hotspot magmatism.
Assuming all the subsidence is caused by excess mantle heat, temperature
anomalies rarely exceed 100°C and could be somewhat lower if dynamic
flow or composition are important causes of buoyancy. In many cases subsidence
is slower than for normal oceanic lithosphere, suggesting either colder
than normal mantle temperatures, or more likely the emplacement of buoyant
lithospheric root under the magmatic province at the time of its formation. |
Click here to go to Discussion
of this page
|
Introduction
Evidence that the Earth’s mantle circulates is
well documented, yet the influence of deep-seated mantle plumes, some
possibly originating at the core-mantle boundary, is still hotly contested
(e.g., Anderson, 2003; Foulger & Natland,
2003). Areas of elevated topography linked to magmatism greater than
normal in the ocean basins have been historically attributed to greater
melting above a steady-state plume or to the impacting of a newly initiating
plume head on the base of the lithosphere (e.g., Campbell
& Griffiths, 1990). New models, however, attribute excess melting
to lithospheric processes above essentially normal upper mantle (Anderson,
2003). Resolution of this debate is important for understanding the
major controls on terrestrial magmatism and the geochemical evolution
of the Earth.
Although different plume models propose different magnitudes
of thermal anomaly, ranging up to 350°C (Farnetani & Richards,
1994), a common characteristic of deep-seated mantle plumes is their
excess heat relative to the surrounding ambient asthenosphere. Greater
heat results in plume mantle being less dense than normal, allowing
it to rise to the base of the lithosphere. This same excess heat and
buoyancy is also inferred to cause the long-wavelength uplift and shallowing
of the seafloor which can be seen in modern bathymetry around active
hotspots or superswell areas (Crough, 1978; Detrick &
Crough, 1978; McNutt & Judge, 1990; see also Superswell
page).
Ancient plume-driven uplift can also be preserved
in the sedimentary rocks deposited in hotspot regions (e.g.,
White & Lovell, 1997). As a result of plate motion, crust
that is affected by plume activity is removed from over the mantle
thermal anomaly. Continued upper-mantle convection then removes the
hotter, less dense material and allows the crust to subside to normal
depths over periods of tens of millions of years (Olson,
1990; Griffiths
& Campbell, 1991). Although the sedimentary records from continental
margins, most notably in the NE Atlantic and the Kerguelen Plateau,
have been interpreted as showing the effects of plume activity (Brodie
& White, 1994; White & Lovell, 1997; Clift
et al., 1995; Coffin & Gahagan, 1995), anomalous
subsidence possibly linked to plume activity is most readily identified
in oceanic crust because the subsidence behavior of oceanic lithosphere
is relatively simple and well characterized (Parsons & Sclater,
1977;
Stein & Stein, 1992; see also Heatflow
page). Although the absolute depth of any given piece of oceanic crust
will vary depending on the thickness and density of the crust, the
rate at which subsidence occurs subsequent to crustal accretion can
be used to quantify mantle buoyancy because this is controlled by
cooling and thickening of the mantle lithosphere (Parsons & Sclater,
1977).
Isolating the effect of hot asthenosphere on plate
subsidence is simplest if the crust was emplaced close to the crest
of a mid-ocean ridge, as this allows a simple comparison of the subsidence
reconstructed from the sedimentary record with that of normal oceanic
crust. Clift (1997) used this approach to deduce anomalously
shallow depths within the oldest oceanic crust adjacent to the volcanic
rifted margins of the NE Atlantic shortly after continental break-up
in the Eocene (see also Iceland pages).
If all the anomalous depth is assigned to temperature, rather than compositional
buoyancy or dynamic flow, then the degree of misfit with the “normal”
oceanic model can be used to estimate maximum temperature anomaly.
The subsidence of lithosphere affected by plume activity
has been modeled in a variety of ways, treating the plume as either
an isostatic anomaly or as a region of dynamic flow (e.g.,
Ribe & Christensen, 1994; Sleep, 1987, 1990).
Dynamic models generate uplift through the viscous normal stresses that
would be imposed on the base of the lithosphere by an upwelling column
of material. They fit modern bathymetry closely with no requirement
for a temperature anomaly. However, results consistent with the evolving
bathymetry along the Hawaiian seamount chain have also been generated
by simple isostatic, conductive cooling models (Sleep, 1987)
such as that of Ito & Clift (1998) which uses a one-dimensional
thermal diffusion approach. That model allows the hot cushion of plume
material to diffuse away after the initial emplacement resulting in
gradually reducing thermally induced buoyancy with time.
| Figure 1 shows a series
of curves generated from this type of model that shows the difference
in subsidence behavior predicted for oceanic crust emplaced above
normal mantle, above a plume of moderate strength (T = 150°C,
100-km-thick plume head) and above a plume at the high end of
current estimates (T = 350°C, 200-km-thick plume head). In
each case, the end point of the subsidence history is known because
it is the present-day depth of the basement but the initial elevation
is predicted to differ significantly depending on the original
mantle temperature. As a result the predicted subsidence curve
for crust generated above plume mantle is expected to be steeper
than that above normal oceanic mantle. |
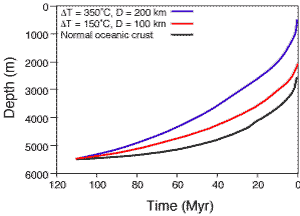
Figure 1: Predicted subsidence patterns for
oceanic lithosphere of 110 Ma age, based on the temperature of
the underlying mantle asthenosphere over which it was emplaced.
The model assumes that the anomalously hot asthenosphere dissipates
with time and that the crust was fully constructed at the start
of the subsidence. Mantle thermal anomalies are seen to have a
major effect on the vertical motions of the crust. |
The predicted subsidence history is slightly more complex
if the emplacement of hot mantle material and associated hotspot volcanism
occured away from an oceanic spreading center. In this case the water
depth shallows as equivalent age crust away from the hotspot as a result
of crustal thickening and the buoyancy of the mantle plume material.
The rate of subsidence of the crust after removal from the hotspot area
and its swell is faster than crust of similar age that was not influenced
by the hotspot. Detrick & Crough (1978) noted such behavior
in the Hawaiian seamount chain, a phenomenon that they attributed to
thermal erosion of the Pacific lithosphere after it passes over the
Hawaiian plume. In this model, although the Hawaiian Islands are much
shallower than the surrounding abyssal seafloor they subside at a faster
rate after they are removed from the immediate influence of the thermally
erosive plume. Alternatively Phipps Morgan et al. (1995) explained
the bathymetry of the Hawaiian Islands as being the result of melt extraction
in the asthenosphere producing a buoyant pillow of mantle residuum centered
beneath the hotspot. This buoyant mantle is partially entrained with
the lithospheric plate as the latter moves away from the hotspot.
In the case of old hotspot provinces it is not always
clear whether the hotspot lavas were emplaced on axis or not. This may
be investigated by comparing basement ages with lithospheric ages. In
the present study I infer the age of the surrounding oceanic lithosphere
on the basis of the nearest identified magnetic anomaly, while the age
of hotspot volcanism is taken from the radiometric age of basement lavas,
or from the biostratigraphic age of overlying sediment if the former
is not available.
In order to assess the magnitude of mantle temperature
anomalies associated with hotspot magmatism I have reconstructed the
subsidence history of a series of oceanic plateaus, ridges or seamounts
using their sedimentary covers. The sites studied include all the major
ocean basins and a wide period of geologic time (Figure 2). The analyses
were made possible through coring by the Deep Sea Drilling Project (DSDP)
and the Ocean Drilling Program (ODP) which recovered sediments overlying
the volcanic sequences. The sediments and fossils found in the cores
allow the depositional environment, and especially the water depth of
deposition, to be constrained. The data were compiled from cruise reports
and associated postcruise papers, particularly those describing benthic
foraminifer fauna, which are sensitive water depth indicators.
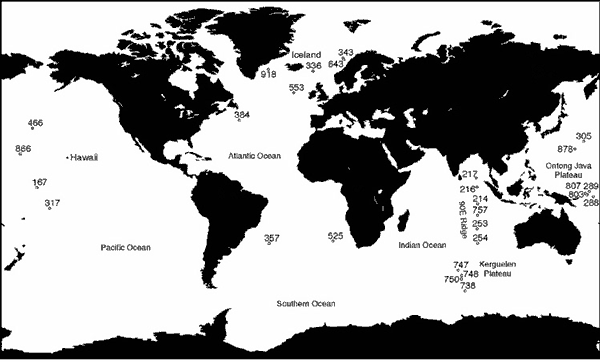
Figure 2: The locations of ODP and DSDP drill sites
considered in this study. They span all major ocean basins and long
periods of geologic time.
Water depth estimation is the principle uncertainty
in the reconstruction of vertical motions of igneous basement and is
generally better where water depths are shallow (< 200 m) as this
is the range where sedimentary structures and benthic foraminifers show
the greatest resolution. Nonetheless, some resolution is possible at
greater depths. For the purpose of the present analysis I assumed that
the current depth of features is the maximum during their history. The
stratigraphy at each drill site was “backstripped” in order
to isolate the tectonic component of the subsidence history. This involves
the correction for sediment loading and restoration of the seafloor
to the estimated depth in the past for each dated interval, assuming
local isostasy (Sclater & Christie, 1980). In doing so
the vertical motion of the igneous basement subsequent to the end of
volcanism can be reconstructed at each drill site. No correction was
made for sea-level variations because of the current lack of clarity
concerning the timing and magnitude of this effect. However, the uncertainties
introduced by this omission are small (~ 100 m) compared to the much
greater values of total subsidence and the general uncertainties in
the water depths.
Examples
Figures 3 – 5 show the results of backstripping
and compare each reconstructed history with that of normal oceanic crust
(Stein & Stein, 1992). In each case the normal oceanic
subsidence curve was shifted to match the modern depth to basement in
order to compare the rates and not the total depth of subsidence. It
is the rate of subsidence that is affected by the mantle thermal state.
Absolute depth is influenced by crustal thickness and thus the degree
of melting, which is partially controlled by mantle temperature, and
also by the chemical state of the mantle and the nature of upwelling
under the hotspot (Mutter et al., 1988). In the case of features
emplaced off-axis a second oceanic subsidence curve is shown indicating
the predicted rate of subsidence if the lithosphere had been totally
reset to zero age at the time of eruption of the basement.
Some of the drill sites show clear evidence for depths
early in their history shallower than predicted for emplacement above
mantle of normal temperature. Sites in the NE Atlantic, the Hatton Bank,
SE Greenland and the Vøring Plateau and even SE Newfoundland
show early depths that are anomalously shallow, i.e., subsidence
curves that are steeper than expected, similar to that seen in modern
Hawaii. Modeling by Clift (1997) indicated that the moderate
nature of the depth anomaly was consistent with a temperature anomaly
of around + 100°C. Outside this region definitive evidence for shallower
depths following eruption is scarce as many of the sites fall within
the predicted trend of crust overlying normal upper mantle temperatures.
Where water depth uncertainties are large the possibility of hot mantle
exists but is not required. There appear to be as many sites, if not
more, where the reconstructed depth to basement after emplacement is
deeper than predicted for normal mantle temperatures. This raises the
possibility that the asthenosphere under the sites has actually heated,
not cooled since emplacement, though this is perhaps unlikely.
| 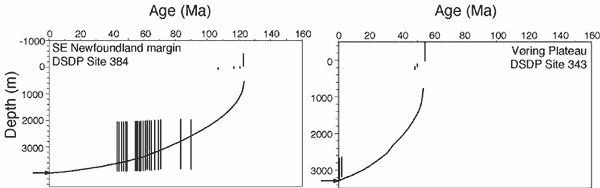
Figure 3: Reconstructed basement subsidence
curves from the North Atlantic showing the depths of the basement
in SE Newfoundland and the Vøring Plateau of Norway, which
are shallower after the initial eruption than predicted by a normal
oceanic subsidence curve (Stein & Stein, 1992). This is consistent
with rapid crustal emplacement above mantle with a temperature
anomaly of around + 100°C.
|
A number of models have been proposed to account for
the lack of subsidence observed in old hotspot regions. The relative
lack of subsidence and initial submarine eruption of lavas in the Ontong
Java and Manihiki Plateaus led Ito & Clift (1998) to propose
growth of these features in two or more stages. In practice they argued
that the plateaus are inflated through time by underplating spanning
the period 120 to 90 Ma. In this case uplift caused by crustal growth
counteracted the subsidence driven by lithospheric cooling. This model
is practical in that particular setting because these plateaux remained
approximately stationary over the proposed plume source during that
time. However, it is not appropriate to many other igneous provinces,
which moved rapidly relative to their sources, e.g., the NinetyEast
Ridge.
The Mid Pacific Mountains
and MIT Guyot
The Mid Pacific Mountains and MIT Guyot (ODP site 878)
are good examples of features that appear to represent excess melting,
moved rapidly in the hotspot reference frame after emplacement, and
are not associated with a hotspot track. Their subsidence histories
are slower than predicted for normal oceanic crust of their age, the
opposite of that predicted if they were emplaced over hot asthenosphere.
Long-term crustal accretion is not a reasonable explanation for the
slow subsidence of this type of hotspot. Instead mantle processes must
be inhibiting subsidence.
Most likely the presence of buoyant, depleted mantle
residue from melting is acting as a cushion beneath them. Mantle from
which melt has been extracted has a lower density than normal depleted
upper mantle. If this material was not advected away it could inhibit
subsidence (Robinson, 1988). Such a compositional-derived density
model for hotspots was invoked by Phipps Morgan et al. (1995)
for the Hawaiian swell and may be applicable to many Pacific and Indian
Ocean hotspot features. What is surprising is that although Phipps
Morgan et al. (1995) consider depleted residue to be more viscous
that normal asthenosphere, they predict that it disperses over long
periods of geologic time, resulting in a reduction in the height and
width of the Hawaiian Swell. That prediction is at odds with the long-term
lack of subsidence found by many of the reconstructions presented here,
which require much of the buoyant residue to remain under the hotspot
edifice until the present day. This implies that it has a high viscosity.
| 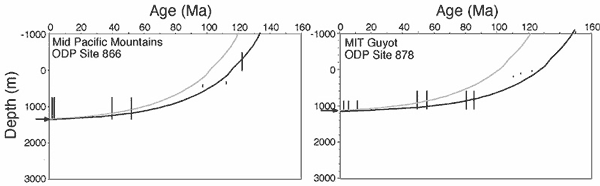
Figure 4: Reconstructed basement subsidence
curves for the Mid Pacific Mountains and MIT Guyot. Basement depths
are approximately the same as those predicted by a normal oceanic
subsidence curve (Stein & Stein, 1992). There is no need to
invoke asthenosphere hotter than normal to account for the subsidence
of these features. Grey curves shows the predicted curves for
crust of the same age as the igneous basement at each site. These
are different from the oceanic lithosphere age. |
Shatksy Rise and
the NinetyEast Ridge
The subsidence patterns of hotspot features in the
modern oceans only occasionally fit simple models for rapid crustal
generation over hot mantle followed by subsidence faster than normal
after the ridge or seamount was removed from the thermal anomaly by
plate motion. The normal or slower-than-normal subsidence seen at many
hotspots may signify the presence of a buoyant mantle root. Such subsidence
patterns do not preclude mantle hotter than normal at the time of emplacement,
but they do not require it. Many hotspots are compatible with emplacement
over mantle of normal temperature, followed by conductive cooling of
the type associated with regular oceanic crust. See also Shatsky
page.
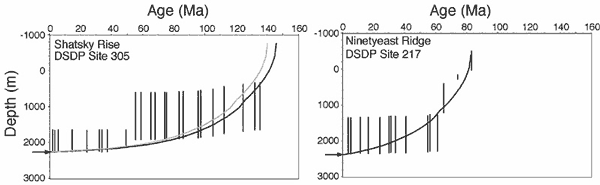
Figure 5: Reconstructed basement subsidence
curves from Shatksy Rise and the NinetyEast Ridge showing that
subsidence is less than predicted by a normal oceanic subsidence
curve (Stein & Stein, 1992). This pattern can be explained
by either gradual growth, emplacement above mantle colder than
normal, or buoyancy linked to a depleted residual mantle root. |
The North Atlantic
margins: Discussion
The North Atlantic margins where subsidence anomalies
do exist are consistent with mantle temperature anomalies of ~ 100°C,
but preclude very hot plume models. This conclusion is supported by
inversion modeling of rare earth element data from hotspot volcanic
rocks that predict temperature anomalies not exceeding 150°C (e.g.,
Watson, 1993; Kent & McKenzie, 1994; Kerr,
1994) and with modeling of the bathymetry of the North Atlantic assuming
a plume-type model (Ribe et al., 1995). If any of the anomalous
shallow depths seen after emplacement are caused by buoyancy resulting
from mantle composition or dynamic mantle upwelling then the temperature
anomalies inferred from the subsidence anomalies would be lower.
Interestingly, results for Site 336 on the
Faeroe-Iceland Ridge show no evidence for anomalous heat since
the start of marine sedimentation. There is a period between
basement emplacement and transgression when depths could have
been shallower than expected but not preserved because the ridge
was subaerial. However, there is no evidence for anomalous
subsidence that might indicate elevated temperature from ~ 42
Ma to the present day. |
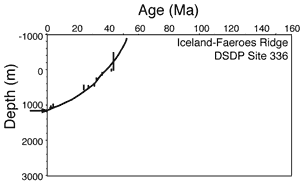
Figure 6: Subsidence curve for DSDP site 336
on the Iceland-Faeroe ridge |
The subsidence behavior of the North Atlantic margins
and the Hawaiian seamount chain appears to differ from many other hotspots.
This may be linked to a different origin associated with hot mantle
that is not required in many other areas. Fast subsidence in these regions
begs the question of why they are not affected by a buoyant mantle residual
root. Perhaps vigorous mantle circulation of the type proposed by Mutter
et al. (1988) to increase melting was responsible for the removal
of any residue that did form. There is little evidence to support the
current presence of a buoyant root in the NE Atlantic related to Tertiary
magmatism. Temporary uplift of the NW European shelf away from the immediate
vicinity of the volcanic margins during their formation is consistent
with the moderate thermal anomaly derived from the oceanic crust subsidence
histories (Clift et al., 1998), modern heatflow (Stein
& Stein, 2003) and the modeling of rare earth element data
(Kerr, 1994).
Summary
The sedimentary records of many hotspot provinces worldwide
do not require the mantle to be hotter than normal at the time of magmatic
crustal growth. In the few examples where hotter mantle is required
the temperature anomaly is no more than ~ 100°C and could be much
less if dynamic flow and compositional buoyancy contribute to driving
temporary uplift.
Other pages on mantle temperature include Heatflow,
Temperature and Mantle
temperature.
|
Acknowledgment
This research used data provided by the Ocean Drilling
Program (ODP). ODP is sponsored by the U.S. National Science Foundation
(NSF) and participating countries under management of Joint Oceanographic
Institutions (JOI), Inc. |
-
D. L. Anderson, Science, 293,
2016 (2001).
-
J. Brodie, N. White, Geology, 22,
147 (1994).
-
I.H. Campbell, R.W. Griffiths, Earth Planet.
Sci. Lett., 99, 79 (1990).
-
P.D. Clift, A. Carter, A.J. Hurford, J. Geol.
Soc., Lond., 155, 787 (1998).
-
P.D. Clift, J. Turner, Mar. Petrol. Geol.,
15, 223 (1998).
-
P.D. Clift, Earth Planet. Sci. Lett.,
146, 195 (1997).
-
P.D. Clift, J. Turner and ODP Leg 152 Scientific
Party, J. Geophys. Res., 100, 24,473 (1995).
-
M.F. Coffin, L. Gahagan, J. Geol. Soc., Lond.,
152, 1047 (1995).
-
S.T. Crough, Geophys. J. Roy. Astr. Soc.,
55, 451 (1978).
-
R.S. Detrick, S.T., J. Geophys. Res.,
83, 1236 (1978).
-
C.G. Farnetani, M.A. Richards, J. Geophys.
Res., 99, 13,813 (1994).
-
G.R. Foulger, J.H. Natland, Science, 300,
921 (2003).
-
R.W. Griffiths, I.H. Campbell, J. Geophys.
Res., 96, 18,295 (1991).
-
G. Ito, P.D. Clift, Earth Planet. Sci. Lett.,
161, 85, 1998.
-
R.W. Kent, D. P. McKenzie, Min. Mag.,
58A, 471 (1994).
-
A.C. Kerr, Chem. Geol., 122,
43 (1995).
-
M.K. McNutt, A.V. Judge, Science, 248,
969 (1990).
-
P. Olson, in Magma transport and storage,
M. P. Ryan, Ed., (John Wiley and Sons Ltd, , London, 1990).
-
B. Parsons, J.G. Sclater, J. Geophys. Res.,
82, 803 (1977).
-
J. Phipps Morgan, W. J. Morgan, E. Price, J.
Geophys. Res., 100, 8045 (1995).
-
J.C. Mutter, W.R. Buck, C.M., Zehnder, J.
Geophys. Res., 93, 1031 (1988).
-
N.M. Ribe, U.R. Christensen, J. Geophys. Res.,
99, 669 (1994).
- N.M. Ribe, U.R. Christensen and J. Theissing, Earth Planet. Sci.
Lett., 134, 155-168 (1995).
-
M.A. Richards, R.A. Duncan, V.E. Courtillot, Science,
246, 103 (1989).
-
E.M. Robinson, Earth Planet. Sci. Lett.,
90, 221 (1988).
-
J.G. Sclater, P.A.F. Christie, J. Geophys.
Res., 85, 3711 (1980).
-
N.H. Sleep, J. Geophys. Res., 95,
6715 (1990).
-
N.H. Sleep, Geophys. J. R. Astro. Soc.,
91, 1 (1987).
-
C.A. Stein, S. Stein, Nature, 359,
123 (1992).
-
C. Stein, S. Stein, Astron. Geophys.,
44, 1.8 (2003).
-
S. Watson, J. Petrol., 34,
763 (1993).
-
N. White, B. Lovell, Nature, 387,
888 (1997).
|
Discussion
Mon Jun 7, 2004: Edward Winterer
I understand why this paper of Peter Clift got into trouble with reviewers
(I was not one of them). The subsidence curves based on benthic forams
are so poorly constrained as to be almost meaningless. I refer you to
a paper I wrote about the limitations and pitfalls of all this in Winterer,
E.L. (1998) Paleobathymetry of Mediterranean Tethyan Jurassic pelagic
sediments. Memorie, Società Geologica Italiana, 53,
97-131. Also, I actually calculated a subsidence curve at Resolution
Guyot in the Midpacs, based on the best data we got from drilling,.
He should at least have looked at that one, in ODP volume 143, published
in 1993.
Mon Jun 7, 2004: Peter Clift
Thanks for your comments on the web page and the reference to your paper
in Memorie, Società Geologica Italiana. I agree
of course that the uncertainties in deep water sediments are pretty
poor, although we can at least be certain that they are deep water sediments
and not shallow. The web page actually only shows a small number
of the sites that I have backstripped. I have in fact looked at
ODP Site 866 on Resolution Guyot within the Mid Pacs and it too shows
no clear evidence for anomalous subsidence rates that would require
a hot asthenosphere. As you know this curve is constrained by
the presence of oolitiic limestone of Barremian age at the base so my
confidence is pretty good with that result. In practise this is
often the case that the depth of eruption is well known but is overlain
by deep water poorly known sediments. Nonetheless, the total amount
of subsidence is thus well constrained and can be used to compare asthenospheric
temperatures at the time of eruption and the modern day.
Mon Jun 7, 2004: Edward Winterer
One other thing to keep in mind is that seamounts, especially big ones,
go through a two-stage subsidence. Hawaii, for example, is still in
the flexural, isostatic stage, which can be very rapid (2.5 m/ky) but
as soon as volcanism ceases, the rate shifts to that of the underlying
oceanic lithosphere, which subsides (thermally) much more slowly. Dave
Clague and his MBARI gang and I have been working and publishing on
this and Ed Purdy and I have a (submitted) paper on barrier reefs that
exploits this behavior. The 1600-m Resolution Guyot shallow-water carbonate
succession records only the slower regime, while the older, faster rates
are in drowned fringing reef down the flanks, neither exposed (buried
under talus) nor sampled.
A second cause of complication is the moat-and-swell
effect on nearby seamounts, exemplified by islands like Oahu, which
record a bobbing motion as younger volcanoes are emplaced to the south
and as huge landslides are offloaded. As you point out, you are looking
only for the “big” effect (hot asthenosphere or not), but
it would be nice to find really clean examples.
Mon Jun 7, 2004: Peter Clift
I agree that subsidence is a complex thing and that flexure around hotspots
can complicate the subsidence history but generally speaking I would
think that this would be a moderate amplitude, short duration ripple
in subsidence histories that last 50-120 Ma. I am focusing only on the
longer-duration thermal subsidence in this work, as I am not sure that
the syn-volcanic rapid subsidence is even preserved in much of the sediment
cover, so I like your idea that the fringe reefs may be the key to that
process.
I am intrigued to see how very infrequently the model
for rapid emplacement over a plume seems to be even closely satisfied,
although it does seem to work in the Hawaiian islands and in the NE
Atlantic to some extent. My feeling is that these areas are likely somewhat
hot.
Thursday Jun 10, 2004: Ian Campbell
Peter Clift has made an assumption in his modeling; he assumes
that the old, hot material in a plume below the lithosphere is dissipated
by a combination of mantle convection and the plate moving away from
the plume. This is not what is expected. Because the old
plume material remains hot for a long time it remains buoyant and continues
to try to rise. It sticks to the overlying plate and follows plate
when it move away from the plume. A plume head takes ~1,000 Myr
to cool. We are less certain how long a plume tail takes to cool
because it diameter is less well constrained.
I have always been puzzled by the “documented”
lack of uplift before the Siberian plume. Gerry Czamanske's contribution
makes this clearer [Ed: See Siberia
page]. He describe a basin developing prior to the eruption of
the Traps, which he correctly interprets as evidence for subsidence,
but then goes onto describe erosional features below the Traps.
The plume hypothesis makes no prediction of what will happen 10 to 50
Myr prior to eruption of the basalts so it does not preclude the formation
of a sedimentary basin. However it does predict uplift in the
1 to 5 Myr before eruption and the most likely way this will manifest
itself is in erosion below the flood basalt, just what Gerry describes.
You will have seen Montelli's paper [Ed: see A
variety of plumes in the mantle?] in which she claims to have been
able to trace 20 plumes to the CMB. However, some such as Iceland
stop at the bottom of the upper mantle which I would not expect.
Plumes must come from a thermal boundary layer and it is unlikely that
there are two in the mantle.
Thursday Jun 10, 2004: Peter Clift
Ian Campbell is right that the modelling that predicts faster subsidence
of plume influenced lithosphere requires dissipation of the plume head
asthenosphere through time. The lack of this faster subsidence in many
old hotspots does need some long-term buoyancy in the mantle to explain
it. I had favored the model of a depleted mantle root, but a permanent
hot cushion would do the job as well. The problem in both cases is that
the sediment record in these scenarios does not provide any information
about mantle temperature, neither supporting or disproving hot plume
models.
There are exceptions in Hawaii and the NE Atlantic
where the cooling models I used do seem to work. Its not clear to me
at the moment why a buoyant plume cushion or a depleted root would not
remain attached to the base of the plate in these areas alone, especially
as these are the most powerful modern plume candidates. Dynamic uplift
in the NE Atlantic is seen at the onset of hotspot volcanism though
the NW European area for sure, though it's magnitude is more in tune
with a 100°C anomaly plume rather than a 300°C one.
One thing that still puzzles me if the hot cushion
model is correct is why so many of the hotspots fall so close to the
Stein & Stein (1992) regular depth-age curve. It would
seem remarkable that 90 East Ridge, Hess Rise, Mid Pacific Mountains,
MIT Guyot, Manahiki Plateau, Walvis Ridge and the Rio Grande Ridge for
example all show curves that agree well with the normal cooling curve.
They don't seem to be either subsiding quickly as I would have guessed
from my model or being buoyed up in the fashion that Ian describes.
Either the two processes are cancelling each other out or they are cooling
and subsiding above mantle of close to normal temperatures.
Friday June 11th, 2004: Don Anderson
The plume model does not predict rapid emplacement (or rapid termination
of magmatism). Courtillot & Richards in their plume heads-tails
paper summarized the known properties of LIPs and pointed out that they
were generally erupted in a million years or less. Since these (e.g.
LIPs) were known to be caused by plumes, this became a property of plumes,
rather than an observation to be explained. In subsequent papers, Richards
and others–with fluid dynamic modeling – could not come
up with such short times (emplacement times being limited by the viscosity
of the lower mantle rather than local stress changes). On the other
hand, the lithospheric stress-valve mechanism permits rapid onset and
shut-off of magmatism, but can also allow long durations. The numerous
very short volcanic chains, and the rapid change in magma flux –
even in Hawaii – strongly support the stress control hypothesis.
The main remaining question, then, is whether the asthenosphere is close
to the melting point or whether it is so cold and uniform that deep
heat and material is required to melt it and replenish it, as in the
plume hypothesis.
The residual plume-head thermal effect that Anderson,
Tanimoto and Zhang looked for in their surface-wave tomographic studies–the
absence of an upper mantle LVZ under LIPs was one of the reasons that
have been used to discount thermal plumes (plus low heat flow and no
uplift). It is often stated that tomography does not have the resolution
to detect plumes but this shallow effect, plus the predicted ponding
beneath other barriers, such as the 650 km endothermic boundary, is
easy to detect with surface waves and other techniques. Plume heads,
and the flattened pancakes that plume heads become, have not been found.
Plume tails have not been found either except with first arrival P-waves
where the coverage is poor (or even non-existent) and source, streaking
and smearing artfacts cannot be cancelled out. Skepticism (“documented”
– in quotes – lack of uplift), puzzlement, and “not
expected”s are common when a favorite paradigm is in distress.
These, plus apparent paradoxes and unexplained coincidences
(association of flood basalts with deep sedimentary basins, sutures
and craton edges) have motivated some Earth scientists to explore mechanisms
that do not involve transfer of heat and material from the core mantle
boundary into the upper mantle. A large plume head in the upper mantle
must cause uplift, low-velocity and, eventually, high-heatflow, and
anomalous subsidence. The lack of support for any of these predictions
at any proposed plume site should give one pause, and sufficient motivation
to investigate alternative models, including those that do not require
core-mantle type temperatures under LIPs. Both hot-cushions and fast-residues
(mutually exclusive predictions and post-dictions of the plume-head
hypothesis), and lithospheric rejuvenations, are easy to spot with surface
waves and receiver functions, but are not required in alternate hypotheses.
Although one might be able to rationalize the lack of precursory uplift
and anomalous subsidence in a few places, the fact that all continental
flood basalt (CFB) provinces, as far as I know, are on top of deep sedimentary
basins suggests a tectonic origin (stretching, thinning, extension and
subsidence). The fact that all CFB are emplaced in sutures – involving
one or more cratons – also suggests, if not demands, a tectonic,
rather than a CMB, explanation.
Modern research has shown that the mantle is hotter
than assumed in the plume model, that the melting point is lower, and
that the melting point and chemistry of the shallow mantle are highly
variable. We also know that the stress in the lithosphere is highly
variable and that the stress-valve mechanism can turn magmatism on and
off. Recent amendments to the plume hypothesis involve large distance
lateral transport in the shallow mantle, rapid motions of hotspots,
and the use of eclogite to reduce the melting point. These are features
of models that do not involve plumes at all. Altogether, this means
that plumes are not necessary to explain variations in bathymetry and
melting rates or the locations of melting anomalies. Arguments based
on uplift and subsidence, as well as those based on fixity, chemistry,
eruption duration and heatflow, seem to favor lithospheric and asthenospheric
(basically non-thermal) explanations, without the numerous surprises
and paradoxes that have accompanied the plume model since its inception.
The plate model predicts long-wavelength variations in mantle temperature
and heat flow, but abrupt changes in lithospheric stress and thickness,
mantle composition and melting point; this seems to be what the data
is telling us. Peter’s work, when added to magma temperatures,
LIP durations, heatflow, absence of uplift and lithospheric thinning,
surface wave tomography and mantle petrology, seems to close the book
on localized high-temperature explanations for melting anomalies.
The lack of fixity and parallelism of chains, and the
large number of isolated volcanoes (no associated chains, no LIPs, no
heads, no tracks) with “hotspot” chemistry, has motivated
some workers to seriously look at the stress and crack ideas again (even
before the uplift/subsidence paradoxes were raised) . Physics (pressure
and Prandtl number considerations) also is not on the side of the plume
model. Athermal and tectonic explanations – involving fertility,
stress and ponding, rather than high temperature – need to be
put back on the table. The alternative is to keep modifying a favorite
hypothesis – and rationalizing the data and the failure of predictions
– in ways that Karl Popper warned us against, at least in the
practice of good science. More recently, philosophers of science have
discredited Popper’s idea of falsification because scientists
have a facility for propping up failing theories and rationalizing contrary
data-falsification appears to be no more viable than proof.
last updated 4th July, 2006
|
|
|
